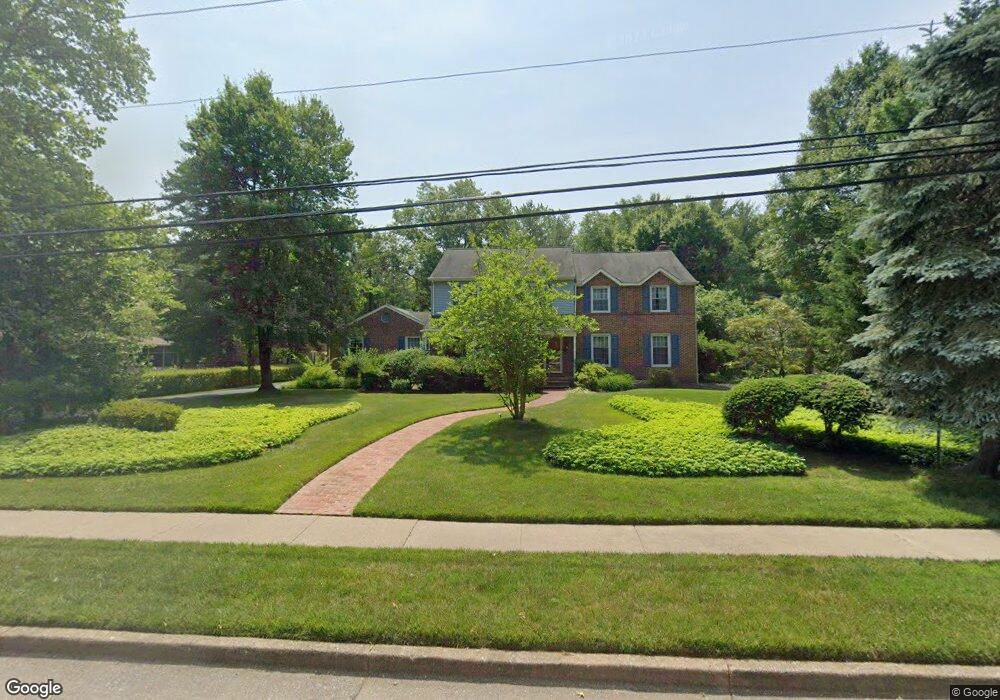
602 Mount Lebanon Rd Unit EDENR Wilmington, DE 19803
Fairfax NeighborhoodEstimated Value: $753,000 - $892,000
4
Beds
3
Baths
2,950
Sq Ft
$277/Sq Ft
Est. Value
About This Home
This home is located at 602 Mount Lebanon Rd Unit EDENR, Wilmington, DE 19803 and is currently estimated at $816,950, approximately $276 per square foot. 602 Mount Lebanon Rd Unit EDENR is a home located in New Castle County with nearby schools including Lombardy Elementary School, Springer Middle School, and Brandywine High School.
Ownership History
Date
Name
Owned For
Owner Type
Purchase Details
Closed on
May 9, 2013
Sold by
Kupferman Scott H
Bought by
Kupferman Scott H and Scott H Kupferman Trust
Current Estimated Value
Purchase Details
Closed on
Sep 25, 2012
Sold by
Stephenson Edward R and Stephenson Tonya M
Bought by
Kupferman Scott H
Home Financials for this Owner
Home Financials are based on the most recent Mortgage that was taken out on this home.
Original Mortgage
$349,000
Outstanding Balance
$242,580
Interest Rate
3.59%
Mortgage Type
FHA
Estimated Equity
$574,370
Purchase Details
Closed on
Mar 24, 2011
Sold by
Urbano Alfred R and Urbano Dian C
Bought by
Stephenson Edward R and Stephenson Tonya M
Home Financials for this Owner
Home Financials are based on the most recent Mortgage that was taken out on this home.
Original Mortgage
$417,000
Interest Rate
3.62%
Mortgage Type
VA
Create a Home Valuation Report for This Property
The Home Valuation Report is an in-depth analysis detailing your home's value as well as a comparison with similar homes in the area
Home Values in the Area
Average Home Value in this Area
Purchase History
| Date | Buyer | Sale Price | Title Company |
|---|---|---|---|
| Kupferman Scott H | -- | None Available | |
| Kupferman Scott H | $436,500 | None Available | |
| Stephenson Edward R | $442,000 | None Available |
Source: Public Records
Mortgage History
| Date | Status | Borrower | Loan Amount |
|---|---|---|---|
| Open | Kupferman Scott H | $349,000 | |
| Previous Owner | Stephenson Edward R | $417,000 |
Source: Public Records
Tax History Compared to Growth
Tax History
| Year | Tax Paid | Tax Assessment Tax Assessment Total Assessment is a certain percentage of the fair market value that is determined by local assessors to be the total taxable value of land and additions on the property. | Land | Improvement |
|---|---|---|---|---|
| 2024 | $5,922 | $155,100 | $26,200 | $128,900 |
| 2023 | $5,410 | $155,100 | $26,200 | $128,900 |
| 2022 | $5,502 | $155,100 | $26,200 | $128,900 |
| 2021 | $5,502 | $155,100 | $26,200 | $128,900 |
| 2020 | $5,503 | $155,100 | $26,200 | $128,900 |
| 2019 | $5,816 | $155,100 | $26,200 | $128,900 |
| 2018 | $5,263 | $155,100 | $26,200 | $128,900 |
| 2017 | $5,182 | $155,100 | $26,200 | $128,900 |
| 2016 | $5,175 | $155,100 | $26,200 | $128,900 |
| 2015 | $4,766 | $155,100 | $26,200 | $128,900 |
| 2014 | $4,760 | $155,100 | $26,200 | $128,900 |
Source: Public Records
Map
Nearby Homes
- 1106 Invermere Way
- 1108 Invermere Rd
- 1105 Invermere Rd
- 331 Spalding Rd
- 1115 Invermere Rd
- 0 Concord Mall Unit DENC2076028
- 133 Lynthwaite Farm Ln
- 402 Marianna Dr
- 7 Median Dr
- 319 Mcdaniel Ave
- 4002 Greenmount Dr
- 2402 Wellesley Ave
- 16 S Rockland Falls Rd
- 18 Kendall Ct
- 208 Hoyer Ct
- 43 Millstone Ln Unit 43
- 3934 Thompsons Bridge Rd
- 240 Sandra Rd
- 3313 Pierson Dr
- 215 Potomac Rd
- 602 Mount Lebanon Rd
- 604 Mount Lebanon Rd
- 501 Andover Rd
- 505 Andover Rd
- 503 Andover Rd
- 507 Andover Rd
- 606 Mount Lebanon Rd
- 615 Mount Lebanon Rd
- 613 Mount Lebanon Rd
- 617 Mount Lebanon Rd
- 509 Andover Rd
- 611 Mount Lebanon Rd
- 619 Mount Lebanon Rd
- 608 Mount Lebanon Rd
- 511 Andover Rd
- 622 Kilburn Rd
- 609 Mount Lebanon Rd
- 620 Kilburn Rd
- 700 Burnley Rd
- 624 Kilburn Rd