
Landlord's Agent in 2026
Valerie Sammis-Westerlund
Real Broker, LLC
(702) 521-6449
1 in this area
13 Total Sales


Estimated Value: $144,000 - $204,000
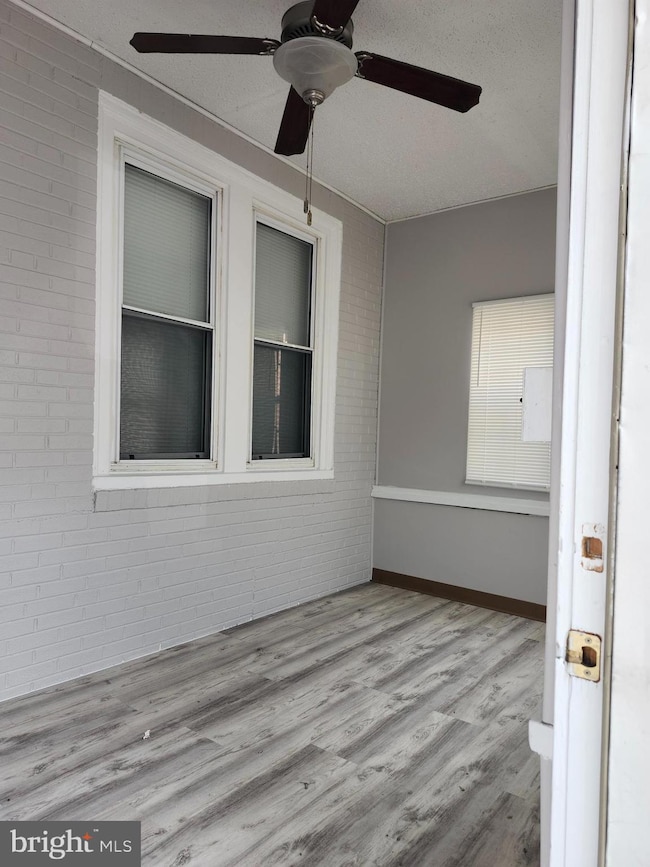
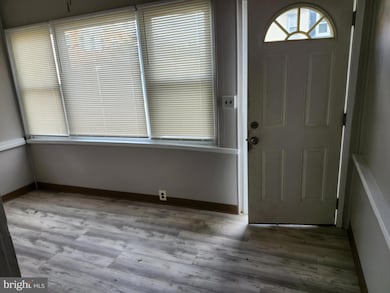
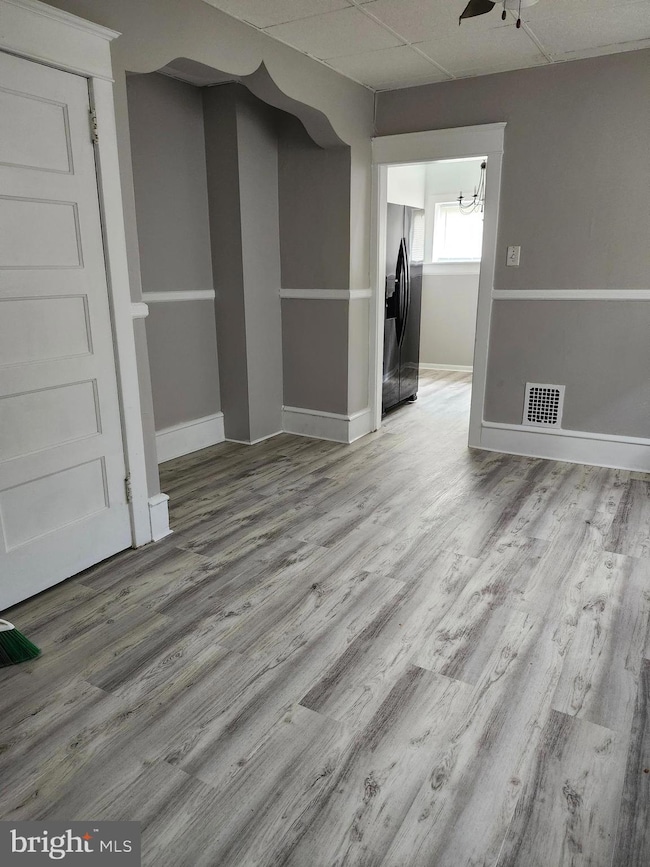
Back on the market - Newly remodeled 3 bedroom 1 bath rental close to everything! Currently in the finishing touches of being remodeled and is now ready for showings **Property managed by OakStreet Property Management. **All applicants must complete rental application through OakStreet. $50 application fee. Contact the Agent to schedule showing and to apply. Text message listing agent for much faster response.
Last Agent to Rent the Property
(856) 240-1072 jeremiah@jfkliving.com Real Broker, LLC Brokerage Phone: 8562401072 License #1758931 Listed on: 10/10/2025
Last Renter's Agent
(856) 240-1072 jeremiah@jfkliving.com Real Broker, LLC Brokerage Phone: 8562401072 License #1758931 Listed on: 10/10/2025
| Date | Buyer | Sale Price | Title Company |
|---|---|---|---|
| Yorkshire Properties Llc | -- | Eheresman Alexxys | |
| Yorkshire Properties Llc | -- | None Listed On Document | |
| Cooperman Michael | $56,000 | None Listed On Document | |
| Cooperman Michael | $56,000 | None Listed On Document | |
| Helm Shane K | $45,000 | -- |
| Date | Status | Borrower | Loan Amount |
|---|---|---|---|
| Previous Owner | Yorkshire Properties Llc | $109,200 | |
| Previous Owner | Cooperman Michael | $44,800 |
| Date | Event | Price | List to Sale | Price per Sq Ft |
|---|---|---|---|---|
| 01/29/2026 01/29/26 | Rented | $1,950 | 0.0% | -- |
| 12/25/2025 12/25/25 | Under Contract | -- | -- | -- |
| 10/10/2025 10/10/25 | For Rent | $1,950 | -- | -- |
| Year | Tax Paid | Tax Assessment Tax Assessment Total Assessment is a certain percentage of the fair market value that is determined by local assessors to be the total taxable value of land and additions on the property. | Land | Improvement |
|---|---|---|---|---|
| 2025 | $3,173 | $63,300 | $15,800 | $47,500 |
| 2024 | $3,168 | $63,300 | $15,800 | $47,500 |
| 2023 | $3,168 | $63,300 | $15,800 | $47,500 |
| 2022 | $2,978 | $63,300 | $15,800 | $47,500 |
| 2021 | $2,949 | $63,300 | $15,800 | $47,500 |
| 2020 | $2,847 | $63,300 | $15,800 | $47,500 |
| 2019 | $2,789 | $63,300 | $15,800 | $47,500 |
| 2018 | $2,735 | $63,300 | $15,800 | $47,500 |
| 2017 | $2,678 | $63,300 | $15,800 | $47,500 |
| 2016 | $2,577 | $63,300 | $15,800 | $47,500 |
| 2015 | $2,801 | $76,400 | $15,800 | $60,600 |
| 2014 | $2,927 | $55,800 | $9,900 | $45,900 |
Landlord's Agent in 2026
Valerie Sammis-Westerlund
Real Broker, LLC
(702) 521-6449
1 in this area
13 Total Sales
Source: Bright MLS
MLS Number: NJCD2102812
APN: 14-00081-0000-00018
Disclaimer: Certain information contained herein is derived from information provided by parties other than Homes.com. All information provided is deemed reliable, but is not guaranteed to be accurate and should be independently verified.
![]() The data relating to real estate for sale on this website appears in part through the BRIGHT Internet Data Exchange program, a voluntary cooperative exchange of property listing data between licensed real estate brokerage firms, and is provided by BRIGHT through a licensing agreement.
The data relating to real estate for sale on this website appears in part through the BRIGHT Internet Data Exchange program, a voluntary cooperative exchange of property listing data between licensed real estate brokerage firms, and is provided by BRIGHT through a licensing agreement.
Listing information is from various brokers who participate in the Bright MLS IDX program and not all listings may be visible on the site.
The property information being provided on or through the website is for the personal, non-commercial use of consumers and such information may not be used for any purpose other than to identify prospective properties consumers may be interested in purchasing.
Some properties which appear for sale on the website may no longer be available because they are for instance, under contract, sold or are no longer being offered for sale.
Property information displayed is deemed reliable but is not guaranteed.
Copyright 2026 Bright MLS, Inc.
Ask me questions while you tour the home.