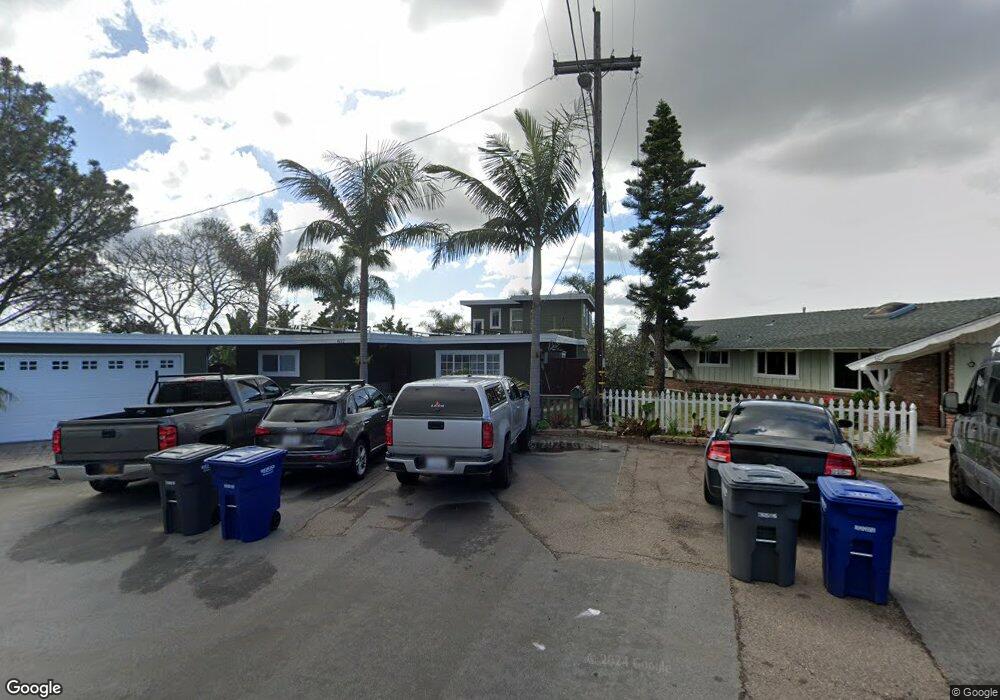
602 Ridgeline Place Solana Beach, CA 92075
Estimated Value: $2,400,000 - $4,148,000
4
Beds
3
Baths
2,365
Sq Ft
$1,300/Sq Ft
Est. Value
About This Home
This home is located at 602 Ridgeline Place, Solana Beach, CA 92075 and is currently estimated at $3,075,320, approximately $1,300 per square foot. 602 Ridgeline Place is a home located in San Diego County with nearby schools including Skyline Elementary School, Solana Vista Elementary School, and Earl Warren Middle School.
Ownership History
Date
Name
Owned For
Owner Type
Purchase Details
Closed on
Dec 20, 2016
Sold by
Zehner Lori Jo and Zehner Kevin John
Bought by
Zehner Kevin J and Zehner Lori Jo
Current Estimated Value
Purchase Details
Closed on
Nov 9, 2012
Sold by
Zehner Kevin John and Zehner Lori Jo
Bought by
Zehner Lori Jo and Zehner Kevin John
Home Financials for this Owner
Home Financials are based on the most recent Mortgage that was taken out on this home.
Original Mortgage
$355,000
Interest Rate
3.35%
Mortgage Type
New Conventional
Purchase Details
Closed on
Dec 11, 1997
Sold by
Goodwin Glenda L
Bought by
Zehner Kevin John and Zehner Lori Jo
Home Financials for this Owner
Home Financials are based on the most recent Mortgage that was taken out on this home.
Original Mortgage
$260,000
Interest Rate
7.16%
Purchase Details
Closed on
Oct 5, 1983
Create a Home Valuation Report for This Property
The Home Valuation Report is an in-depth analysis detailing your home's value as well as a comparison with similar homes in the area
Home Values in the Area
Average Home Value in this Area
Purchase History
| Date | Buyer | Sale Price | Title Company |
|---|---|---|---|
| Zehner Kevin J | -- | None Available | |
| Zehner Lori Jo | -- | Act Title | |
| Zehner Kevin John | $325,000 | Chicago Title Co | |
| -- | $190,000 | -- |
Source: Public Records
Mortgage History
| Date | Status | Borrower | Loan Amount |
|---|---|---|---|
| Previous Owner | Zehner Lori Jo | $355,000 | |
| Previous Owner | Zehner Kevin John | $260,000 |
Source: Public Records
Tax History Compared to Growth
Tax History
| Year | Tax Paid | Tax Assessment Tax Assessment Total Assessment is a certain percentage of the fair market value that is determined by local assessors to be the total taxable value of land and additions on the property. | Land | Improvement |
|---|---|---|---|---|
| 2025 | $6,167 | $518,924 | $216,127 | $302,797 |
| 2024 | $6,167 | $508,750 | $211,890 | $296,860 |
| 2023 | $6,046 | $498,776 | $207,736 | $291,040 |
| 2022 | $5,960 | $488,997 | $203,663 | $285,334 |
| 2021 | $5,866 | $479,410 | $199,670 | $279,740 |
| 2020 | $5,820 | $474,495 | $197,623 | $276,872 |
| 2019 | $5,721 | $465,193 | $193,749 | $271,444 |
| 2018 | $5,608 | $456,072 | $189,950 | $266,122 |
| 2017 | $5,507 | $447,130 | $186,226 | $260,904 |
| 2016 | $5,201 | $438,364 | $182,575 | $255,789 |
| 2015 | $5,116 | $431,780 | $179,833 | $251,947 |
| 2014 | $5,009 | $423,323 | $176,311 | $247,012 |
Source: Public Records
Map
Nearby Homes
- 455 Glencrest Dr
- 401 Santa Dominga
- 930 Via Mil Cumbres Unit 141
- 1015 Via Mil Cumbres
- 241 E Cliff St
- 1108 Via Mil Cumbres
- 779 Barbara Ave
- 1110 Solana Dr
- 422 Seabright Ln
- 630 Camino Ynez
- 505 N Cedros Ave
- 810 Seabright Ln
- 308 Corto St
- 1155 Santa Luisa Dr
- 649 Seabright Ln
- 602 Fresca St
- 147 S Rios Ave
- 701 Valley Ave
- 148 N Acacia Ave
- 515 N Acacia Ave
- 601 Ridgeline Place
- 608 Ridgeline Place
- 609 Ridgeline Place
- 616 Ridgeline Place
- 617 Ridgeline Place
- 634 Glencrest Place
- 628 Glencrest Place
- 624 - 622 Ridgeline Place
- 622 Ridgeline Place Unit 24
- 667 Solana Hills Ct
- 624 Ridgeline Place
- 624 Ridgeline Place Unit 622
- 667 Solana Hills Ct
- 659 Solana Hills Ct
- 651 Solana Hills Ct
- 622 Glencrest Place
- 625 Ridgeline Place
- 643 Solana Hills Ct
- 635 Solana Hills Ct
- 633 Glencrest Place