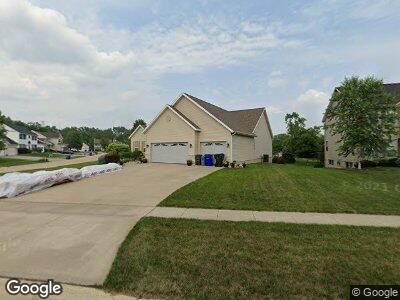
6020 Flagstone Dr NE Cedar Rapids, IA 52402
Estimated Value: $344,000 - $484,270
5
Beds
4
Baths
3,805
Sq Ft
$115/Sq Ft
Est. Value
About This Home
This home is located at 6020 Flagstone Dr NE, Cedar Rapids, IA 52402 and is currently estimated at $436,068, approximately $114 per square foot. 6020 Flagstone Dr NE is a home located in Linn County with nearby schools including Bowman Woods Elementary School, Oak Ridge School, and Linn-Mar High School.
Ownership History
Date
Name
Owned For
Owner Type
Purchase Details
Closed on
May 11, 2015
Sold by
Morud Gregory Lee and Kenworthy Yvonne M
Bought by
Morud Gregory Lee and Kenworthy Yvonne M
Current Estimated Value
Purchase Details
Closed on
Jan 10, 2011
Sold by
Cook Trevor R and Cook Keri A
Bought by
Morud Gregory Lee
Home Financials for this Owner
Home Financials are based on the most recent Mortgage that was taken out on this home.
Original Mortgage
$212,000
Outstanding Balance
$14,615
Interest Rate
4.82%
Mortgage Type
New Conventional
Estimated Equity
$421,453
Purchase Details
Closed on
Jul 30, 2004
Sold by
Midwest Development Co
Bought by
Cook Trevor R and Cook Keri A
Home Financials for this Owner
Home Financials are based on the most recent Mortgage that was taken out on this home.
Original Mortgage
$267,013
Interest Rate
4.5%
Mortgage Type
Unknown
Create a Home Valuation Report for This Property
The Home Valuation Report is an in-depth analysis detailing your home's value as well as a comparison with similar homes in the area
Home Values in the Area
Average Home Value in this Area
Purchase History
| Date | Buyer | Sale Price | Title Company |
|---|---|---|---|
| Morud Gregory Lee | -- | None Available | |
| Morud Gregory Lee | $301,500 | None Available | |
| Cook Trevor R | $333,500 | -- |
Source: Public Records
Mortgage History
| Date | Status | Borrower | Loan Amount |
|---|---|---|---|
| Open | Morud Gregory Lee | $212,000 | |
| Previous Owner | Cook Trevor R | $267,013 | |
| Closed | Cook Trevor R | $66,753 |
Source: Public Records
Tax History Compared to Growth
Tax History
| Year | Tax Paid | Tax Assessment Tax Assessment Total Assessment is a certain percentage of the fair market value that is determined by local assessors to be the total taxable value of land and additions on the property. | Land | Improvement |
|---|---|---|---|---|
| 2023 | $8,536 | $432,300 | $79,300 | $353,000 |
| 2022 | $7,874 | $382,400 | $72,100 | $310,300 |
| 2021 | $8,252 | $364,600 | $72,100 | $292,500 |
| 2020 | $8,252 | $360,100 | $72,100 | $288,000 |
| 2019 | $7,394 | $326,800 | $62,500 | $264,300 |
| 2018 | $7,074 | $326,800 | $62,500 | $264,300 |
| 2017 | $7,317 | $345,200 | $57,700 | $287,500 |
| 2016 | $7,317 | $327,100 | $57,700 | $269,400 |
| 2015 | $7,561 | $337,693 | $57,655 | $280,038 |
| 2014 | $7,366 | $337,693 | $57,655 | $280,038 |
| 2013 | $7,118 | $337,693 | $57,655 | $280,038 |
Source: Public Records
Map
Nearby Homes
- 327 Hampden Dr NE
- 320 Hampden Dr NE
- 220 Windsor Dr NE
- 5712 Golden Ct NE Unit 60
- 6612 Kent Dr NE
- 5711 Golden Ct NE Unit 44
- 960 Linnview Dr
- 334 Boyson Rd NE
- 1060 W 9th Ave
- 6615 Brentwood Dr NE
- 361 Essex Dr NE
- 377 Cambridge Dr NE
- 7006 Candlewick Dr NE
- 1013 Blairs Ferry Rd
- 6927 Brentwood Dr NE
- 371 Carnaby Dr NE
- 755 Alpine Rd
- 640 Colton Cir NE Unit 7
- 2733 Brookfield Dr
- 460 Hilltop Rd
- 6020 Flagstone Dr NE
- 6014 Flagstone Dr NE
- 129 Teakwood Ln NE
- 6008 Flagstone Dr NE
- 201 Teakwood Ln NE
- 123 Teakwood Ln NE
- 122 Teakwood Ln NE
- 200 Teakwood Ln NE
- 118 Teakwood Ln NE
- 6007 Flagstone Dr NE
- 6002 Flagstone Dr NE
- 117 Teakwood Ln NE
- 205 Teakwood Ln NE
- 114 Teakwood Ln NE
- 206 Teakwood Ln NE
- 6001 Flagstone Dr NE
- 5930 Flagstone Dr NE
- 111 Teakwood Ln NE
- 209 Teakwood Ln NE
- 110 Teakwood Ln NE