6022 Westgate Dr Unit 201 Orlando, FL 32835
MetroWest NeighborhoodEstimated Value: $179,273 - $192,000
2
Beds
1
Bath
2,570
Sq Ft
$72/Sq Ft
Est. Value
About This Home
This home is located at 6022 Westgate Dr Unit 201, Orlando, FL 32835 and is currently estimated at $185,818, approximately $72 per square foot. 6022 Westgate Dr Unit 201 is a home located in Orange County with nearby schools including Metrowest Elementary, Chain of Lakes Middle School, and Olympia High.
Ownership History
Date
Name
Owned For
Owner Type
Purchase Details
Closed on
May 18, 2010
Sold by
Haaz Inc
Bought by
Mears Charles
Current Estimated Value
Purchase Details
Closed on
Oct 2, 2009
Sold by
Kanji Hafiz
Bought by
Haaz Inc
Purchase Details
Closed on
Feb 26, 2009
Sold by
Saxon Mortgage Services Inc
Bought by
Kanji Hafiz
Purchase Details
Closed on
Sep 9, 2008
Sold by
Broskie John T and Deutsche Bank Trust Co America
Bought by
Saxon Mortgage Services Inc
Purchase Details
Closed on
Sep 8, 2005
Sold by
Mcrae & Stolz Orlando Llc
Bought by
Broskie John T
Home Financials for this Owner
Home Financials are based on the most recent Mortgage that was taken out on this home.
Original Mortgage
$139,120
Interest Rate
6.25%
Mortgage Type
Fannie Mae Freddie Mac
Create a Home Valuation Report for This Property
The Home Valuation Report is an in-depth analysis detailing your home's value as well as a comparison with similar homes in the area
Home Values in the Area
Average Home Value in this Area
Purchase History
| Date | Buyer | Sale Price | Title Company |
|---|---|---|---|
| Mears Charles | $69,900 | Attorney | |
| Haaz Inc | -- | None Available | |
| Kanji Hafiz | $47,500 | Attorney | |
| Saxon Mortgage Services Inc | -- | Attorney | |
| Broskie John T | $173,900 | Sunbelt Title Agency |
Source: Public Records
Mortgage History
| Date | Status | Borrower | Loan Amount |
|---|---|---|---|
| Previous Owner | Broskie John T | $139,120 |
Source: Public Records
Tax History Compared to Growth
Tax History
| Year | Tax Paid | Tax Assessment Tax Assessment Total Assessment is a certain percentage of the fair market value that is determined by local assessors to be the total taxable value of land and additions on the property. | Land | Improvement |
|---|---|---|---|---|
| 2025 | $1,414 | $119,210 | -- | -- |
| 2024 | $1,333 | $119,210 | -- | -- |
| 2023 | $1,333 | $112,476 | $0 | $0 |
| 2022 | $1,279 | $109,200 | $21,840 | $87,360 |
| 2021 | $1,303 | $109,200 | $21,840 | $87,360 |
| 2020 | $1,756 | $109,200 | $21,840 | $87,360 |
| 2019 | $1,718 | $102,800 | $20,560 | $82,240 |
| 2018 | $1,559 | $90,000 | $18,000 | $72,000 |
| 2017 | $1,382 | $74,500 | $14,900 | $59,600 |
| 2016 | $1,228 | $60,500 | $12,100 | $48,400 |
| 2015 | $1,380 | $75,800 | $15,160 | $60,640 |
| 2014 | $1,250 | $65,700 | $13,140 | $52,560 |
Source: Public Records
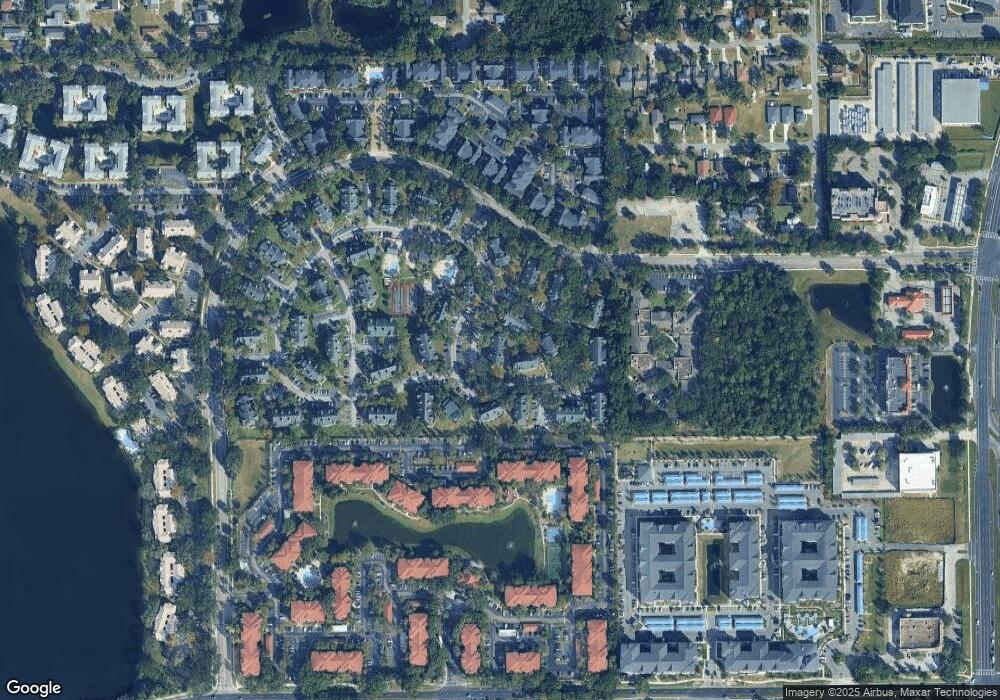
Map
Nearby Homes
- 6040 Westgate Dr Unit 202
- 5962 Westgate Dr Unit 101
- 6004 Westgate Dr Unit 301
- 6106 Westgate Dr Unit 102
- 5968 Westgate Dr Unit 101
- 6052 Westgate Dr Unit 102
- 6142 Westgate Dr Unit 204
- 6142 Westgate Dr Unit 304
- 6142 Westgate Dr Unit 301
- 6148 Westgate Dr Unit 302
- 5953 Westgate Dr Unit 1823
- 6136 Westgate Dr Unit 302
- 6088 Westgate Dr Unit 201
- 6088 Westgate Dr Unit 203
- 6070 Westgate Dr Unit 204
- 6154 Westgate Dr Unit 202
- 6190 Westgate Dr Unit 101
- 6082 Westgate Dr Unit 204
- 5980 Westgate Dr Unit 202
- 6178 Westgate Dr Unit 304
- 6022 Westgate Dr Unit 204
- 6022 Westgate Dr Unit 104
- 6022 Westgate Dr Unit 203
- 6022 Westgate Dr Unit 202
- 6022 Westgate Dr Unit 103
- 6022 Westgate Dr Unit 102
- 6022 Westgate Dr Unit 101
- 5992 Westgate Dr Unit 303
- 5992 Westgate Dr Unit 302
- 5992 Westgate Dr Unit 301
- 5992 Westgate Dr Unit 204
- 5992 Westgate Dr Unit 203
- 5992 Westgate Dr Unit 202
- 5992 Westgate Dr Unit 201
- 5992 Westgate Dr Unit 104
- 5992 Westgate Dr Unit 103
- 5992 Westgate Dr Unit 102
- 5992 Westgate Dr Unit 101
- 5992 Westgate Dr Unit 304
- 6040 Westgate Dr Unit 201