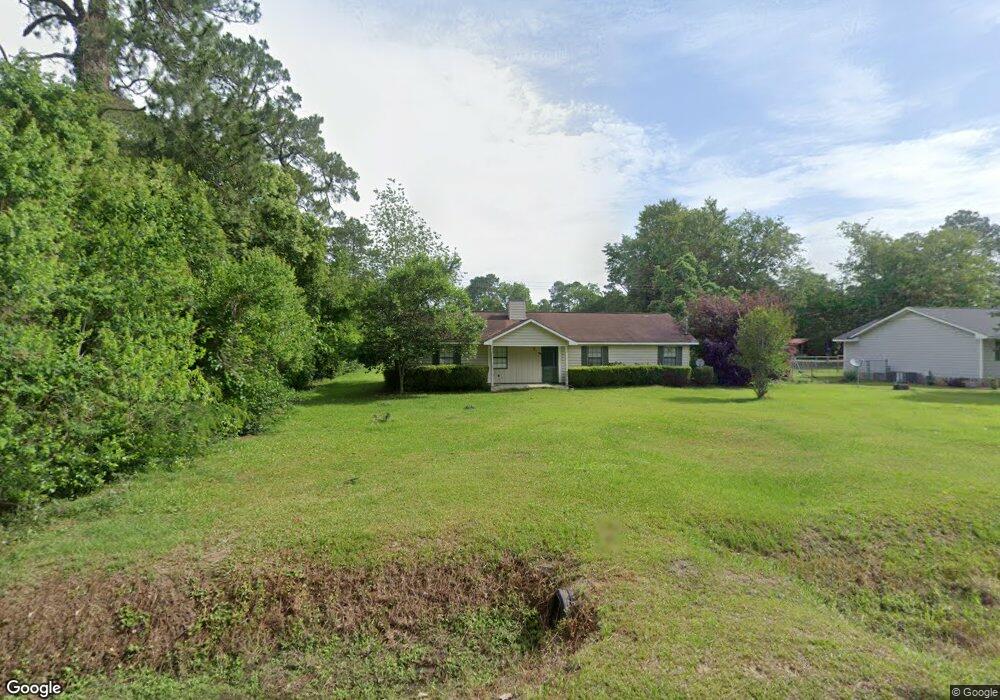
603 E 27th Ave Cordele, GA 31015
Estimated Value: $114,000 - $175,000
2
Beds
2
Baths
1,432
Sq Ft
$105/Sq Ft
Est. Value
About This Home
This home is located at 603 E 27th Ave, Cordele, GA 31015 and is currently estimated at $150,247, approximately $104 per square foot. 603 E 27th Ave is a home located in Crisp County with nearby schools including Crisp County Elementary School, Crisp County Primary School, and Crisp County Middle School.
Ownership History
Date
Name
Owned For
Owner Type
Purchase Details
Closed on
Nov 13, 2012
Sold by
Shadeed Connie
Bought by
Mcginnis Properties Llc
Current Estimated Value
Home Financials for this Owner
Home Financials are based on the most recent Mortgage that was taken out on this home.
Original Mortgage
$42,500
Interest Rate
3.4%
Mortgage Type
New Conventional
Purchase Details
Closed on
Jan 1, 2012
Sold by
Gray Rita C
Bought by
Gray Rita C
Purchase Details
Closed on
Mar 16, 1998
Sold by
Sheppard Bobby
Bought by
Gray Rita C
Purchase Details
Closed on
Dec 31, 1993
Sold by
Mid-South Developmt
Bought by
Sheppard Bobby
Purchase Details
Closed on
Apr 7, 1989
Sold by
Sims Donald P
Bought by
Mid-South Developmt
Purchase Details
Closed on
Jan 31, 1985
Bought by
Sims Donald P
Create a Home Valuation Report for This Property
The Home Valuation Report is an in-depth analysis detailing your home's value as well as a comparison with similar homes in the area
Purchase History
| Date | Buyer | Sale Price | Title Company |
|---|---|---|---|
| Mcginnis Properties Llc | $50,000 | -- | |
| Gray Rita C | $68,500 | -- | |
| Gray Rita C | $8,000 | -- | |
| Sheppard Bobby | $60,100 | -- | |
| Mid-South Developmt | $10,000 | -- | |
| Sims Donald P | -- | -- |
Source: Public Records
Mortgage History
| Date | Status | Borrower | Loan Amount |
|---|---|---|---|
| Closed | Mcginnis Properties Llc | $42,500 |
Source: Public Records
Tax History
| Year | Tax Paid | Tax Assessment Tax Assessment Total Assessment is a certain percentage of the fair market value that is determined by local assessors to be the total taxable value of land and additions on the property. | Land | Improvement |
|---|---|---|---|---|
| 2025 | $1,601 | $45,392 | $3,000 | $42,392 |
| 2024 | $1,494 | $41,677 | $3,000 | $38,677 |
| 2023 | $1,462 | $38,997 | $1,500 | $37,497 |
| 2022 | $1,008 | $38,153 | $1,500 | $36,653 |
| 2021 | $988 | $35,868 | $1,500 | $34,368 |
| 2020 | $1,010 | $35,868 | $1,500 | $34,368 |
| 2019 | $1,017 | $35,868 | $1,500 | $34,368 |
| 2018 | $1,059 | $35,930 | $2,400 | $33,530 |
| 2017 | $1,459 | $35,930 | $2,400 | $33,530 |
| 2016 | $1,062 | $35,930 | $2,400 | $33,530 |
| 2015 | -- | $35,930 | $2,400 | $33,530 |
| 2014 | -- | $35,930 | $2,400 | $33,530 |
| 2013 | -- | $35,929 | $2,400 | $33,529 |
Source: Public Records
Map
Nearby Homes
Your Personal Tour Guide
Ask me questions while you tour the home.