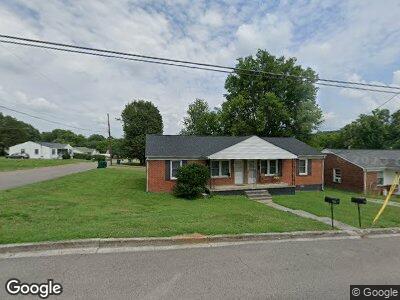
603 Elm St Unit 605 Pulaski, TN 38478
Estimated Value: $118,866 - $229,000
--
Bed
2
Baths
1,604
Sq Ft
$111/Sq Ft
Est. Value
About This Home
This home is located at 603 Elm St Unit 605, Pulaski, TN 38478 and is currently estimated at $177,967, approximately $110 per square foot. 603 Elm St Unit 605 is a home located in Giles County with nearby schools including Pulaski Elementary School, Southside Elementary School, and Bridgeforth Middle School.
Ownership History
Date
Name
Owned For
Owner Type
Purchase Details
Closed on
Mar 15, 2000
Sold by
Hargrove Richard H
Bought by
Jones William G and Jones Leann
Current Estimated Value
Purchase Details
Closed on
May 22, 1991
Bought by
Hargrove Richard H and Hargrove Babette B
Purchase Details
Closed on
Aug 2, 1985
Bought by
Butler Robert E
Purchase Details
Closed on
Jan 2, 1981
Bought by
Not Available
Create a Home Valuation Report for This Property
The Home Valuation Report is an in-depth analysis detailing your home's value as well as a comparison with similar homes in the area
Home Values in the Area
Average Home Value in this Area
Purchase History
| Date | Buyer | Sale Price | Title Company |
|---|---|---|---|
| Jones William G | $65,000 | -- | |
| Hargrove Richard H | $35,200 | -- | |
| Butler Robert E | -- | -- | |
| -- | $25,000 | -- |
Source: Public Records
Tax History Compared to Growth
Tax History
| Year | Tax Paid | Tax Assessment Tax Assessment Total Assessment is a certain percentage of the fair market value that is determined by local assessors to be the total taxable value of land and additions on the property. | Land | Improvement |
|---|---|---|---|---|
| 2024 | $1,027 | $42,640 | $2,720 | $39,920 |
| 2023 | $1,027 | $42,640 | $2,720 | $39,920 |
| 2022 | $1,027 | $42,640 | $2,720 | $39,920 |
| 2021 | $1,000 | $29,520 | $2,720 | $26,800 |
| 2020 | $1,000 | $29,520 | $2,720 | $26,800 |
| 2019 | $834 | $29,520 | $2,720 | $26,800 |
| 2018 | $1,000 | $29,520 | $2,720 | $26,800 |
| 2017 | $1,000 | $29,520 | $2,720 | $26,800 |
| 2016 | $1,080 | $30,480 | $2,600 | $27,880 |
| 2015 | $1,018 | $30,480 | $2,600 | $27,880 |
| 2014 | $1,018 | $30,470 | $0 | $0 |
Source: Public Records
Map
Nearby Homes
- 635 Cleveland St Unit 637
- 402 Pine St Unit A/B
- 402 Pine St
- 627 Dogwood St
- 540 Cleveland St
- 221 Pine St
- 547 E College St
- 534 E College St
- 437 E College St
- 113 N Ingram St
- 265 Mimosa Dr
- 538 E Madison St
- 927 E Jefferson St
- 604 E Jefferson St
- 207 N Cedar Ln
- 513 E Washington St Unit 513/515
- 513 E Washington St Unit 515
- 209 Glendale Dr
- 520 E Woodring St
- 339 E Washington St
- 603 Elm St Unit 605
- 607 Elm St Unit 609
- 715 Wilson Ave Unit 717
- 613 Elm St Unit 615
- 525 Elm St
- 716 Wilson Ave Unit 718
- 641 Wilson Ave
- 619 Elm St Unit 621
- 721 Wilson Ave
- 614 Elm St
- 622 S Ingram St Unit 620
- 722 Wilson Ave
- 517 Elm St
- 518 Elm St
- 622 Elm St
- 625 Elm St
- 516 S Ingram St
- 520 S Ingram St
- 626 S Ingram St
- 633 Wilson Ave