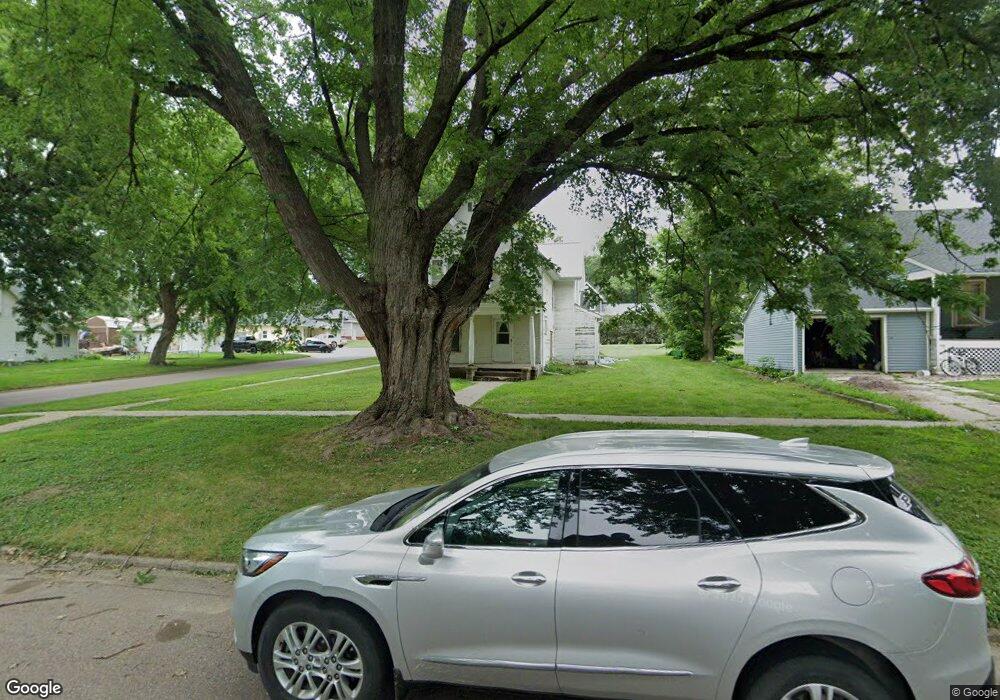
603 Fulton St Remsen, IA 51050
Estimated Value: $120,325
4
Beds
3
Baths
1,802
Sq Ft
$67/Sq Ft
Est. Value
About This Home
This home is located at 603 Fulton St, Remsen, IA 51050 and is currently estimated at $120,325, approximately $66 per square foot. 603 Fulton St is a home located in Plymouth County with nearby schools including Remsen-Union Elementary School, St. Catherine-St. Mary's Grade School, and Great Beginnings Preschool.
Create a Home Valuation Report for This Property
The Home Valuation Report is an in-depth analysis detailing your home's value as well as a comparison with similar homes in the area
Home Values in the Area
Average Home Value in this Area
Tax History Compared to Growth
Tax History
| Year | Tax Paid | Tax Assessment Tax Assessment Total Assessment is a certain percentage of the fair market value that is determined by local assessors to be the total taxable value of land and additions on the property. | Land | Improvement |
|---|---|---|---|---|
| 2025 | $1,000 | $84,140 | $23,730 | $60,410 |
| 2024 | $1,048 | $79,310 | $23,730 | $55,580 |
| 2023 | $1,010 | $84,310 | $18,250 | $66,060 |
| 2022 | $1,008 | $69,540 | $18,250 | $51,290 |
| 2021 | $974 | $69,540 | $18,250 | $51,290 |
| 2020 | $974 | $63,830 | $18,250 | $45,580 |
| 2019 | -- | $63,830 | $18,250 | $45,580 |
| 2018 | -- | $59,900 | $18,250 | $41,650 |
| 2017 | -- | $58,110 | $0 | $0 |
| 2016 | -- | $58,110 | $0 | $0 |
| 2015 | -- | $56,270 | $0 | $0 |
| 2014 | -- | $0 | $0 | $0 |
Source: Public Records
Map
Nearby Homes
- 620 Harrison St
- 626 Harrison St
- 418 Madison St
- 512 Kennedy St
- 138 Madison St
- 17575 Otter Ave
- 23576 Highway 140
- 403 N Linn St
- 408 Holmes St
- 203 N Beech St
- 1121 2nd St SE
- 582 Penny Ln
- 15 Park Village
- TBD Park Village
- 10 7th Ave SE
- 790 Cedar View Dr Unit 401
- 729 7th Ave SE
- 307 9th St SE
- 321 2nd Ave SE
- LOT 6 19th St SE