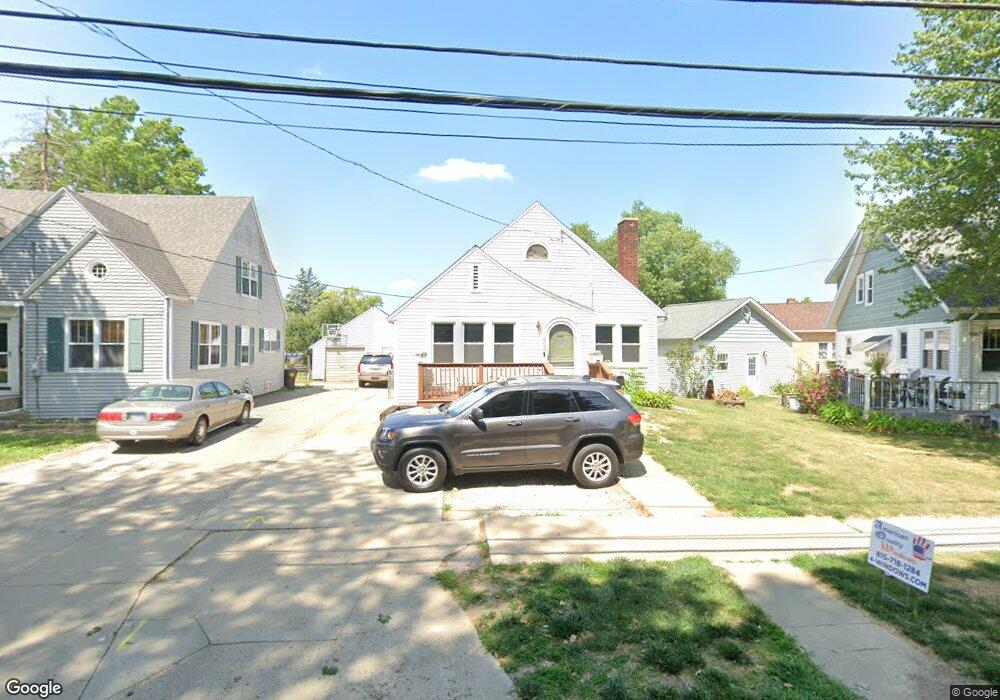
603 Genesee Ave Morrison, IL 61270
Estimated Value: $85,005 - $150,000
Studio
--
Bath
--
Sq Ft
9,583
Sq Ft Lot
About This Home
This home is located at 603 Genesee Ave, Morrison, IL 61270 and is currently estimated at $114,251. 603 Genesee Ave is a home located in Whiteside County with nearby schools including Northside School, Southside School, and Morrison Junior High School.
Ownership History
Date
Name
Owned For
Owner Type
Purchase Details
Closed on
May 28, 2024
Sold by
Parks Gage A and Parks Rebecca R
Bought by
Geras Patricia J
Current Estimated Value
Purchase Details
Closed on
Feb 3, 2023
Sold by
Martin Rhonda G
Bought by
Parks Gage A and Parks Rebecca R
Purchase Details
Closed on
Apr 14, 2022
Sold by
Steen Gary W and Steen Monica C
Bought by
Martin Rhonda G
Home Financials for this Owner
Home Financials are based on the most recent Mortgage that was taken out on this home.
Original Mortgage
$43,500
Interest Rate
3.5%
Mortgage Type
New Conventional
Purchase Details
Closed on
Dec 11, 2012
Sold by
Steen Gary W and Steen Monica C
Bought by
Wieneke Terrence and Wieneke Luann
Create a Home Valuation Report for This Property
The Home Valuation Report is an in-depth analysis detailing your home's value as well as a comparison with similar homes in the area
Home Values in the Area
Average Home Value in this Area
Purchase History
| Date | Buyer | Sale Price | Title Company |
|---|---|---|---|
| Geras Patricia J | $110,000 | None Listed On Document | |
| Parks Gage A | -- | -- | |
| Martin Rhonda G | $58,000 | Heid Law Offices Llc | |
| Wieneke Terrence | -- | None Available |
Source: Public Records
Mortgage History
| Date | Status | Borrower | Loan Amount |
|---|---|---|---|
| Previous Owner | Martin Rhonda G | $43,500 |
Source: Public Records
Tax History
| Year | Tax Paid | Tax Assessment Tax Assessment Total Assessment is a certain percentage of the fair market value that is determined by local assessors to be the total taxable value of land and additions on the property. | Land | Improvement |
|---|---|---|---|---|
| 2024 | $1,974 | $30,202 | $2,261 | $27,941 |
| 2023 | $2,296 | $27,496 | $2,058 | $25,438 |
| 2022 | $2,157 | $25,535 | $1,911 | $23,624 |
| 2021 | $1,597 | $25,005 | $1,871 | $23,134 |
| 2020 | $1,636 | $25,478 | $1,906 | $23,572 |
| 2019 | $2,187 | $25,774 | $1,367 | $24,407 |
| 2018 | $2,272 | $25,659 | $1,361 | $24,298 |
| 2017 | $2,110 | $24,648 | $1,307 | $23,341 |
| 2016 | $2,026 | $23,774 | $1,261 | $22,513 |
| 2015 | $2,111 | $0 | $0 | $0 |
| 2014 | $2,111 | $24,080 | $1,278 | $22,802 |
| 2013 | $2,125 | $24,356 | $1,293 | $23,063 |
Source: Public Records
Map
Nearby Homes
- 509 S Madison St
- 308 S Genesee St
- 109 E Morris St
- 301 S Genesee St
- 302 E Park St
- 503 Portland Ave
- 411 W Park St
- 403 E Park St
- 301 E Wall St
- 418 E Wall St
- 105 E Knox St
- 215 Cedar St
- 503 E Main St
- 513 E Main St
- 402 W Lincolnway
- 505 S Jackson St
- 400 E Knox St
- 404 Elm St
- 101 N Jackson St
- 617 W Lincolnway
- 603 Genesee Ave
- 603 1/2 Genesee Ave
- 101 E Winfield St
- 601 Genesee Ave
- 105 W Winfield St
- 605 Genesee Ave
- 109 W Winfield St
- 100 E Winfield St
- 102 E Winfield St
- 607 Genesee Ave
- 111 W Winfield St
- 600 Genesee Ave
- 600 Genesee Ave
- 106 E Winfield St
- 511 S Genesee St
- 602 Genesee Ave
- 604 Genesee Ave
- 509 S Genesee St
- 609 Genesee Ave
- 110 E Winfield St
Your Personal Tour Guide
Ask me questions while you tour the home.