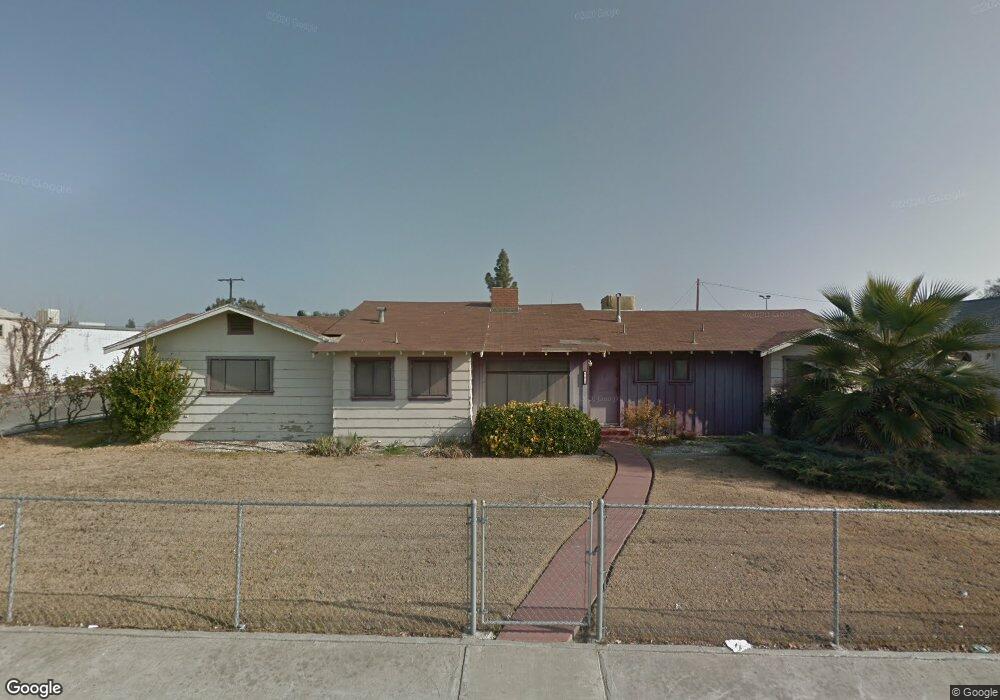
603 S 11th Ave Hanford, CA 93230
Estimated Value: $284,000 - $331,121
3
Beds
2
Baths
1,968
Sq Ft
$158/Sq Ft
Est. Value
About This Home
This home is located at 603 S 11th Ave, Hanford, CA 93230 and is currently estimated at $310,030, approximately $157 per square foot. 603 S 11th Ave is a home located in Kings County with nearby schools including Roosevelt Elementary School, Woodrow Wilson Junior High School, and Hanford West High School.
Ownership History
Date
Name
Owned For
Owner Type
Purchase Details
Closed on
Nov 17, 1999
Sold by
Salas Ann
Bought by
Taylor Leroy and Taylor Linda
Current Estimated Value
Home Financials for this Owner
Home Financials are based on the most recent Mortgage that was taken out on this home.
Original Mortgage
$89,165
Outstanding Balance
$26,614
Interest Rate
7.68%
Mortgage Type
FHA
Estimated Equity
$283,416
Create a Home Valuation Report for This Property
The Home Valuation Report is an in-depth analysis detailing your home's value as well as a comparison with similar homes in the area
Home Values in the Area
Average Home Value in this Area
Purchase History
| Date | Buyer | Sale Price | Title Company |
|---|---|---|---|
| Taylor Leroy | $90,000 | Chicago Title Co |
Source: Public Records
Mortgage History
| Date | Status | Borrower | Loan Amount |
|---|---|---|---|
| Open | Taylor Leroy | $89,165 |
Source: Public Records
Tax History
| Year | Tax Paid | Tax Assessment Tax Assessment Total Assessment is a certain percentage of the fair market value that is determined by local assessors to be the total taxable value of land and additions on the property. | Land | Improvement |
|---|---|---|---|---|
| 2025 | $1,391 | $138,173 | $46,877 | $91,296 |
| 2023 | $1,391 | $132,808 | $45,057 | $87,751 |
| 2022 | $1,359 | $130,205 | $44,174 | $86,031 |
| 2021 | $1,328 | $127,653 | $43,308 | $84,345 |
| 2020 | $1,341 | $126,344 | $42,864 | $83,480 |
| 2019 | $1,317 | $123,867 | $42,024 | $81,843 |
| 2018 | $1,278 | $121,438 | $41,200 | $80,238 |
| 2017 | $1,257 | $119,057 | $40,392 | $78,665 |
| 2016 | $1,239 | $116,723 | $39,600 | $77,123 |
| 2015 | $1,230 | $114,970 | $39,005 | $75,965 |
| 2014 | $1,204 | $112,718 | $38,241 | $74,477 |
Source: Public Records
Map
Nearby Homes
- 821 S 11th Ave
- 901 S 11th Ave
- 670 Grant St
- 10555 Hanford Armona Rd
- 10531 Hanford Armona Rd
- 711 S Del Rio Ct
- 601 S Phillips St
- 0 W 6th St
- 1064 S Anacapa Ave
- 1215 Washington St
- AE 125 S Homestead Ln
- AE 114 S Buffalo Dr
- AE 106 S Walking Wind Way
- AE 120 S Buffalo Dr
- 1001 W 7th St
- 1171 State St
- 207 Ballpark Aly
- 11431 11th Ave
- 1415 Hayden Ave
- 10949 Hume Ave
Your Personal Tour Guide
Ask me questions while you tour the home.