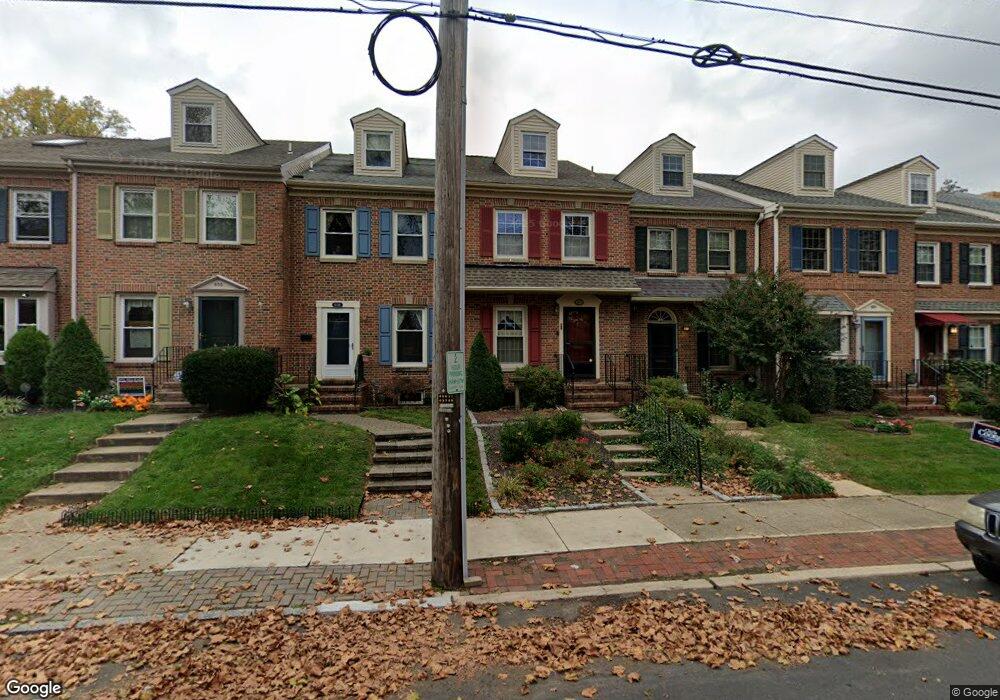
603A W 18th St Wilmington, DE 19802
Triangle NeighborhoodEstimated Value: $302,000 - $592,000
3
Beds
3
Baths
1,472
Sq Ft
$287/Sq Ft
Est. Value
About This Home
This home is located at 603A W 18th St, Wilmington, DE 19802 and is currently estimated at $423,003, approximately $287 per square foot. 603A W 18th St is a home located in New Castle County with nearby schools including Warner Elementary School, The John Dickinson School, and Skyline Middle School.
Ownership History
Date
Name
Owned For
Owner Type
Purchase Details
Closed on
Dec 5, 2024
Sold by
Matarese John F
Bought by
Swyka Robert August
Current Estimated Value
Home Financials for this Owner
Home Financials are based on the most recent Mortgage that was taken out on this home.
Original Mortgage
$215,000
Outstanding Balance
$213,286
Interest Rate
6.72%
Mortgage Type
New Conventional
Estimated Equity
$209,717
Purchase Details
Closed on
Jan 18, 2008
Sold by
Mccants William F and Mccants Casey R
Bought by
Matarese John F
Home Financials for this Owner
Home Financials are based on the most recent Mortgage that was taken out on this home.
Original Mortgage
$168,000
Interest Rate
6.02%
Mortgage Type
Purchase Money Mortgage
Purchase Details
Closed on
Dec 15, 2004
Sold by
Oneill Lillian W
Bought by
Mccants William F and Mccants Casey R
Home Financials for this Owner
Home Financials are based on the most recent Mortgage that was taken out on this home.
Original Mortgage
$200,000
Interest Rate
5.25%
Mortgage Type
Purchase Money Mortgage
Create a Home Valuation Report for This Property
The Home Valuation Report is an in-depth analysis detailing your home's value as well as a comparison with similar homes in the area
Home Values in the Area
Average Home Value in this Area
Purchase History
| Date | Buyer | Sale Price | Title Company |
|---|---|---|---|
| Swyka Robert August | $335,000 | None Listed On Document | |
| Matarese John F | $260,000 | None Available | |
| Mccants William F | $250,000 | -- |
Source: Public Records
Mortgage History
| Date | Status | Borrower | Loan Amount |
|---|---|---|---|
| Open | Swyka Robert August | $215,000 | |
| Previous Owner | Matarese John F | $168,000 | |
| Previous Owner | Mccants William F | $200,000 | |
| Closed | Mccants William F | $50,000 |
Source: Public Records
Tax History Compared to Growth
Tax History
| Year | Tax Paid | Tax Assessment Tax Assessment Total Assessment is a certain percentage of the fair market value that is determined by local assessors to be the total taxable value of land and additions on the property. | Land | Improvement |
|---|---|---|---|---|
| 2024 | $3,002 | $96,200 | $12,100 | $84,100 |
| 2023 | $2,609 | $96,200 | $12,100 | $84,100 |
| 2022 | $2,621 | $96,200 | $12,100 | $84,100 |
| 2021 | $2,616 | $96,200 | $12,100 | $84,100 |
| 2020 | $2,631 | $96,200 | $12,100 | $84,100 |
| 2019 | $4,565 | $96,200 | $12,100 | $84,100 |
| 2018 | $2,619 | $96,200 | $12,100 | $84,100 |
| 2017 | $2,615 | $96,200 | $12,100 | $84,100 |
| 2016 | $2,478 | $96,200 | $12,100 | $84,100 |
| 2015 | $4,077 | $96,200 | $12,100 | $84,100 |
| 2014 | $3,870 | $96,200 | $12,100 | $84,100 |
Source: Public Records
Map
Nearby Homes
- 600 W 20th St
- 2104 Baynard Blvd
- 309 W 19th St
- 305 1/2 W 19th St
- 2004 N Jefferson St
- 1921 N Washington St
- 1802 C N Washington St
- 705 W 22nd St
- 508 W 23rd St
- 1517 N Adams St Unit 13
- 1806 N West St
- 925 Lovering Ave
- 903 Lovering Ave
- 610 Concord Ave
- 223 W 22nd St
- 2400 N Madison St
- 2410 N Monroe St
- 2409 N Madison St
- 508 W 25th St
- 2009 N Tatnall St
- 603 A W 18th St
- 603B W 18th St
- 603 W 18th St
- 605A W 18th St
- 605 W 18th St
- 601 W 18th St
- 607 W 18th St
- 1801 N Monroe St
- 601A W 18th St
- 601B W 18th St
- 1803 N Monroe St
- 1805 N Monroe St
- 1807 N Monroe St
- 1809 N Monroe St
- 602 W 19th St
- 1811 N Monroe St
- 604 W 19th St
- 606 W 19th St
- 1813 N Monroe St
- 608 W 19th St