Estimated Value: $170,015 - $227,000
3
Beds
1
Bath
1,311
Sq Ft
$144/Sq Ft
Est. Value
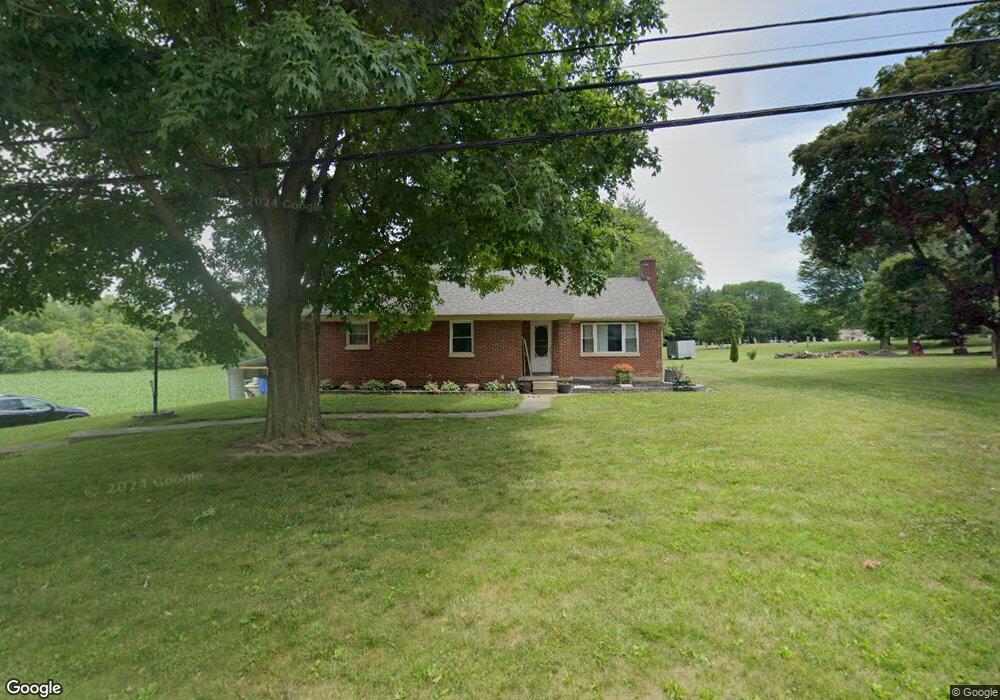
About This Home
This home is located at 604 Adrian St, Delta, OH 43515 and is currently estimated at $188,754, approximately $143 per square foot. 604 Adrian St is a home located in Fulton County with nearby schools including Delta Elementary School, Pike-Delta-York Middle School, and Pike-Delta-York High School.
Ownership History
Date
Name
Owned For
Owner Type
Purchase Details
Closed on
Oct 2, 2017
Sold by
Matthews Jodi L
Bought by
Matthews James J
Current Estimated Value
Purchase Details
Closed on
Aug 17, 2006
Sold by
Wells Fargo Bank Na
Bought by
Matthews James J and Matthews Jodi L
Home Financials for this Owner
Home Financials are based on the most recent Mortgage that was taken out on this home.
Original Mortgage
$88,880
Outstanding Balance
$62,403
Interest Rate
10.15%
Mortgage Type
Purchase Money Mortgage
Estimated Equity
$126,351
Purchase Details
Closed on
Apr 26, 2006
Sold by
Seguin Minnie L
Bought by
Wells Fargo Bank Na
Purchase Details
Closed on
Mar 6, 2001
Sold by
Fraker Tim L
Bought by
Sequin John D
Purchase Details
Closed on
Jan 1, 1990
Bought by
Fraker Tim L and Fraker Christine
Create a Home Valuation Report for This Property
The Home Valuation Report is an in-depth analysis detailing your home's value as well as a comparison with similar homes in the area
Home Values in the Area
Average Home Value in this Area
Purchase History
| Date | Buyer | Sale Price | Title Company |
|---|---|---|---|
| Matthews James J | -- | None Available | |
| Matthews James J | $111,100 | Resource Title Agency Inc | |
| Wells Fargo Bank Na | $73,334 | None Available | |
| Sequin John D | $104,000 | -- | |
| Fraker Tim L | -- | -- |
Source: Public Records
Mortgage History
| Date | Status | Borrower | Loan Amount |
|---|---|---|---|
| Open | Matthews James J | $88,880 |
Source: Public Records
Tax History
| Year | Tax Paid | Tax Assessment Tax Assessment Total Assessment is a certain percentage of the fair market value that is determined by local assessors to be the total taxable value of land and additions on the property. | Land | Improvement |
|---|---|---|---|---|
| 2024 | $2,133 | $46,130 | $12,390 | $33,740 |
| 2023 | $1,961 | $46,130 | $12,390 | $33,740 |
| 2022 | $2,104 | $37,770 | $10,330 | $27,440 |
| 2021 | $2,179 | $37,770 | $10,330 | $27,440 |
| 2020 | $2,164 | $37,770 | $10,330 | $27,440 |
| 2019 | $1,935 | $34,520 | $10,330 | $24,190 |
| 2018 | $1,844 | $34,520 | $10,330 | $24,190 |
| 2017 | $1,836 | $34,520 | $10,330 | $24,190 |
| 2016 | $1,779 | $30,490 | $10,330 | $20,160 |
| 2015 | $1,702 | $30,490 | $10,330 | $20,160 |
| 2014 | $1,699 | $30,490 | $10,330 | $20,160 |
| 2013 | $1,768 | $32,070 | $8,020 | $24,050 |
Source: Public Records
Map
Nearby Homes
- 302 Adrian St
- 308 Monroe St
- 207 Wood St
- 305 Mckinley St
- 8069 Fulton County 7-2
- 518 Providence St
- 8069 County Road 7
- 810 Greenview Ave
- 929 Linwood Ave
- 2049 Pear Tree Ln
- 318 Hidden Ridge Dr
- 2061 Redbud Ln
- 315 Cherrytree Ln
- 2158 Redbud Ln
- 320 Crabtree Ln
- 9294 County Road L
- 7373 County Road 12
- 11470 County Rd E
- 3088 County Road H
- 10487 County Road 4
Your Personal Tour Guide
Ask me questions while you tour the home.