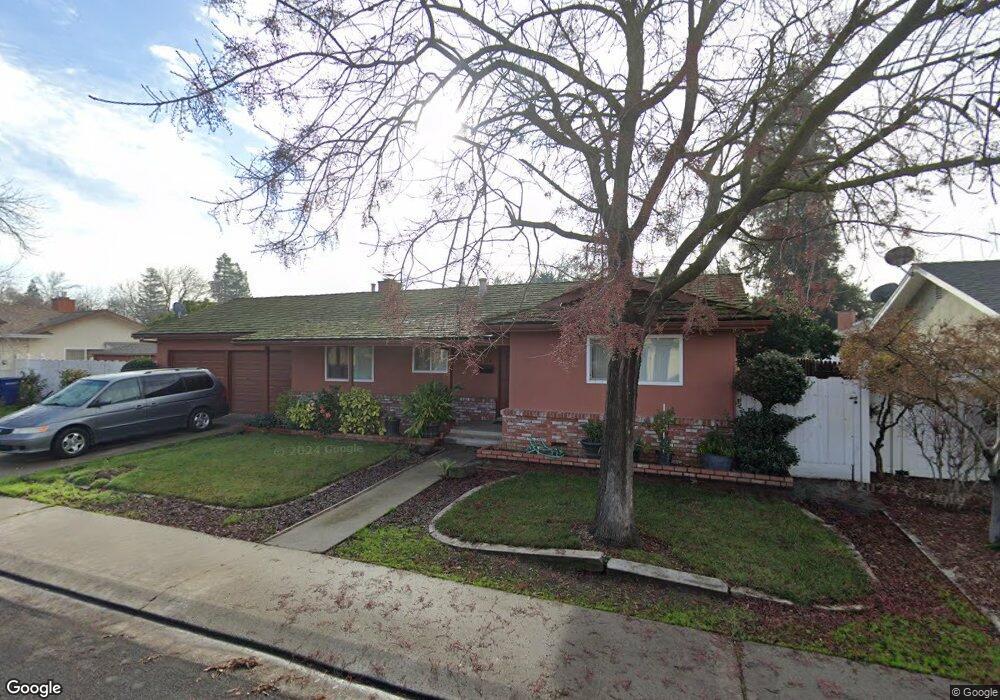
604 Fern St Modesto, CA 95356
Central Modesto NeighborhoodEstimated Value: $449,064 - $553,000
3
Beds
2
Baths
1,388
Sq Ft
$360/Sq Ft
Est. Value
About This Home
This home is located at 604 Fern St, Modesto, CA 95356 and is currently estimated at $499,016, approximately $359 per square foot. 604 Fern St is a home located in Stanislaus County with nearby schools including Woodrow Elementary School, Somerset Middle School, and Grace M. Davis High School.
Ownership History
Date
Name
Owned For
Owner Type
Purchase Details
Closed on
Oct 28, 2020
Sold by
Shah Yogendra and Shah Bhavana
Bought by
Shah Prerak
Current Estimated Value
Purchase Details
Closed on
Sep 28, 2016
Sold by
Shah Yogendra
Bought by
Shah Yogendra and Shah Bhavana
Home Financials for this Owner
Home Financials are based on the most recent Mortgage that was taken out on this home.
Original Mortgage
$103,000
Outstanding Balance
$47,681
Interest Rate
3.46%
Mortgage Type
New Conventional
Estimated Equity
$451,335
Purchase Details
Closed on
Oct 28, 2008
Sold by
Campbell M Terry
Bought by
Shah Yogendra and Shah Bhavana
Home Financials for this Owner
Home Financials are based on the most recent Mortgage that was taken out on this home.
Original Mortgage
$180,000
Outstanding Balance
$115,838
Interest Rate
5.77%
Mortgage Type
Purchase Money Mortgage
Estimated Equity
$383,178
Purchase Details
Closed on
Aug 7, 1998
Sold by
Jones Ira L and Jones Patsy J
Bought by
Jones Ira L and Jones Patsy J
Create a Home Valuation Report for This Property
The Home Valuation Report is an in-depth analysis detailing your home's value as well as a comparison with similar homes in the area
Home Values in the Area
Average Home Value in this Area
Purchase History
| Date | Buyer | Sale Price | Title Company |
|---|---|---|---|
| Shah Prerak | -- | None Available | |
| Shah Yogendra | -- | Orange Coast Title Company | |
| Shah Yogendra | $225,000 | Old Republic Title Company | |
| Jones Ira L | -- | -- |
Source: Public Records
Mortgage History
| Date | Status | Borrower | Loan Amount |
|---|---|---|---|
| Open | Shah Yogendra | $103,000 | |
| Open | Shah Yogendra | $180,000 |
Source: Public Records
Tax History
| Year | Tax Paid | Tax Assessment Tax Assessment Total Assessment is a certain percentage of the fair market value that is determined by local assessors to be the total taxable value of land and additions on the property. | Land | Improvement |
|---|---|---|---|---|
| 2025 | $3,202 | $289,730 | $90,136 | $199,594 |
| 2024 | $3,144 | $284,050 | $88,369 | $195,681 |
| 2023 | $3,084 | $278,482 | $86,637 | $191,845 |
| 2022 | $2,959 | $273,023 | $84,939 | $188,084 |
| 2021 | $2,908 | $267,671 | $83,274 | $184,397 |
| 2020 | $2,865 | $264,928 | $82,421 | $182,507 |
| 2019 | $2,813 | $259,734 | $80,805 | $178,929 |
| 2018 | $2,758 | $254,642 | $79,221 | $175,421 |
| 2017 | $2,692 | $249,650 | $77,668 | $171,982 |
| 2016 | $2,581 | $236,000 | $100,000 | $136,000 |
| 2015 | $2,210 | $202,000 | $53,500 | $148,500 |
| 2014 | $2,101 | $189,000 | $50,000 | $139,000 |
Source: Public Records
Map
Nearby Homes
- 3600 Columbine Dr Unit 6
- 325 Standiford Ave Unit 29
- 3800 Marigold Ln
- 3809 Marigold Ln
- 3728 Fuchsia Ln
- 3837 Marigold Ln
- 3417 John Lee Ln
- 3312 Whitehorse Ave
- 3325 Sherwood Ave
- 365 Birchwood Ct
- 3432 Colonial Dr
- 1013 Colonial Ct
- 1005 Woodrow Ave
- 4125 Mchenry Ave Unit 134
- 4125 Mchenry Ave Unit 69
- 4125 Mchenry Ave Unit 93
- 3701 Colonial Dr Unit 202
- 3701 Colonial Dr Unit 224
- 3701 Colonial Dr
- 3701 Colonial Dr Unit 98
Your Personal Tour Guide
Ask me questions while you tour the home.