Estimated Value: $223,752 - $260,000
4
Beds
2
Baths
1,257
Sq Ft
$190/Sq Ft
Est. Value
About This Home
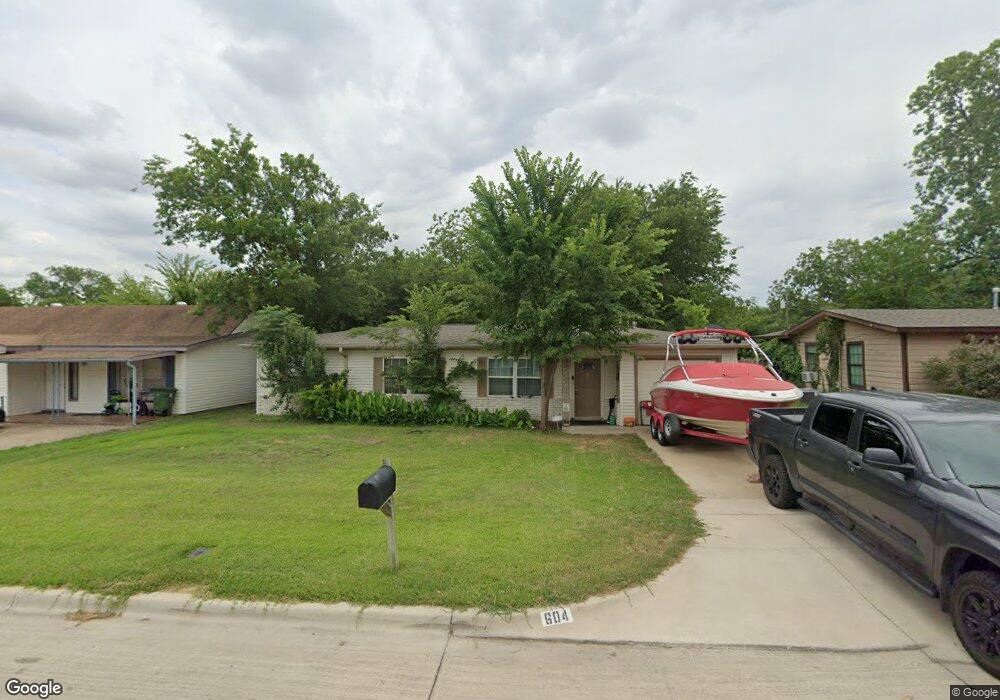
This home is located at 604 Greenway Dr, Hurst, TX 76053 and is currently estimated at $238,938, approximately $190 per square foot. 604 Greenway Dr is a home located in Tarrant County with nearby schools including Bellaire Elementary School, Hurst J High School, and L.D. Bell High School.
Ownership History
Date
Name
Owned For
Owner Type
Purchase Details
Closed on
Mar 9, 2017
Sold by
Taylor Larry D and Smith Taylor Michelle L
Bought by
The Larry Don And Michelle Smith Taylor
Current Estimated Value
Purchase Details
Closed on
May 2, 2011
Sold by
Team Taylor Investments Llc
Bought by
Taylor Larry D and Smith Taylor Michelle L
Purchase Details
Closed on
Jul 22, 2009
Sold by
Alaska Seaboard Partners Limited Partner
Bought by
Team Taylor Llc
Home Financials for this Owner
Home Financials are based on the most recent Mortgage that was taken out on this home.
Original Mortgage
$75,000
Interest Rate
5.44%
Mortgage Type
Purchase Money Mortgage
Purchase Details
Closed on
Mar 3, 2009
Sold by
Markham Thomas E and Markham Jonnie P
Bought by
Alaska Seaboard Partners Limited Partner
Create a Home Valuation Report for This Property
The Home Valuation Report is an in-depth analysis detailing your home's value as well as a comparison with similar homes in the area
Home Values in the Area
Average Home Value in this Area
Purchase History
| Date | Buyer | Sale Price | Title Company |
|---|---|---|---|
| The Larry Don And Michelle Smith Taylor | -- | None Available | |
| Taylor Larry D | -- | None Available | |
| Team Taylor Llc | -- | First American | |
| Alaska Seaboard Partners Limited Partner | $31,025 | None Available |
Source: Public Records
Mortgage History
| Date | Status | Borrower | Loan Amount |
|---|---|---|---|
| Previous Owner | Team Taylor Llc | $75,000 |
Source: Public Records
Tax History Compared to Growth
Tax History
| Year | Tax Paid | Tax Assessment Tax Assessment Total Assessment is a certain percentage of the fair market value that is determined by local assessors to be the total taxable value of land and additions on the property. | Land | Improvement |
|---|---|---|---|---|
| 2025 | $4,295 | $210,304 | $50,000 | $160,304 |
| 2024 | $4,295 | $210,304 | $50,000 | $160,304 |
| 2023 | $3,789 | $189,120 | $35,000 | $154,120 |
| 2022 | $4,301 | $186,818 | $35,000 | $151,818 |
| 2021 | $4,234 | $175,561 | $35,000 | $140,561 |
| 2020 | $2,887 | $120,000 | $35,000 | $85,000 |
| 2019 | $2,937 | $120,000 | $35,000 | $85,000 |
| 2018 | $2,751 | $112,446 | $15,000 | $97,446 |
| 2017 | $2,513 | $99,294 | $15,000 | $84,294 |
| 2016 | $2,193 | $86,646 | $15,000 | $71,646 |
| 2015 | $1,681 | $64,100 | $15,000 | $49,100 |
| 2014 | $1,681 | $64,100 | $15,000 | $49,100 |
Source: Public Records
Map
Nearby Homes
- 712 Brookfield Dr
- 704 Tanglewood Dr
- 720 Tanglewood Dr
- 716 E Pecan St Unit 716 - 722
- 1501 Woodridge Cir
- 1407 Woodridge Cir
- 1302 Woodridge Cir
- 508 Oak Park Dr
- 212 E Ellen Ave
- 1309 Driftwood Dr
- 1200 Tanglewood Trail
- 120 Donald Dr
- 644 Caduceus Ln
- 260 Corinna Ct
- 552 Norwood Dr
- 812 Forest Hollow Dr
- 205 Corinna Ct
- 803 Glenda Dr
- 802 Brown Trail
- 624 Harrison Ln
- 600 Greenway Dr
- 608 Greenway Dr
- 512 Greenway Dr
- 612 Greenway Dr
- 603 Brookfield Dr
- 601 Brookfield Dr
- 607 Brookfield Dr
- 508 Greenway Dr
- 616 Greenway Dr
- 511 Brookfield Dr
- 611 Brookfield Dr
- 603 Greenway Dr
- 607 Greenway Dr
- 601 Greenway Dr
- 507 Brookfield Dr
- 615 Brookfield Dr
- 611 Greenway Dr
- 511 Greenway Dr
- 504 Greenway Dr
- 620 Greenway Dr