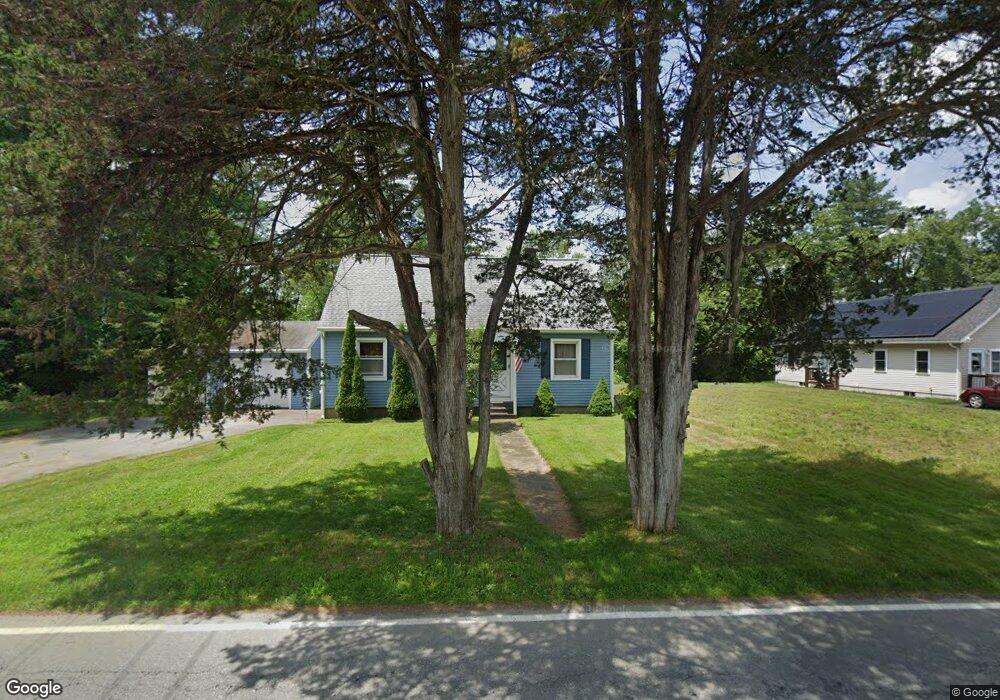
604 Leyden Rd Greenfield, MA 01301
Estimated Value: $302,000 - $337,000
3
Beds
1
Bath
1,170
Sq Ft
$269/Sq Ft
Est. Value
About This Home
This home is located at 604 Leyden Rd, Greenfield, MA 01301 and is currently estimated at $315,083, approximately $269 per square foot. 604 Leyden Rd is a home located in Franklin County with nearby schools including Four Rivers Charter Public School, Cornerstone Christian School, and Greenfield Center School.
Ownership History
Date
Name
Owned For
Owner Type
Purchase Details
Closed on
May 1, 2009
Sold by
Bulley Stacie D
Bought by
Obrien Martin J
Current Estimated Value
Home Financials for this Owner
Home Financials are based on the most recent Mortgage that was taken out on this home.
Original Mortgage
$142,348
Outstanding Balance
$87,241
Interest Rate
4.86%
Mortgage Type
Purchase Money Mortgage
Estimated Equity
$227,842
Purchase Details
Closed on
Apr 10, 2006
Sold by
Bulley David A
Bought by
Bulley Stacie D
Purchase Details
Closed on
Sep 19, 2000
Sold by
Gallant Donald E
Bought by
Bulley David A
Home Financials for this Owner
Home Financials are based on the most recent Mortgage that was taken out on this home.
Original Mortgage
$85,200
Interest Rate
8.07%
Mortgage Type
Purchase Money Mortgage
Purchase Details
Closed on
Dec 7, 1994
Sold by
Simondiski Mary K and Maver Patricia
Bought by
Gallant Donald E
Create a Home Valuation Report for This Property
The Home Valuation Report is an in-depth analysis detailing your home's value as well as a comparison with similar homes in the area
Home Values in the Area
Average Home Value in this Area
Purchase History
| Date | Buyer | Sale Price | Title Company |
|---|---|---|---|
| Obrien Martin J | $145,000 | -- | |
| Obrien Martin J | $145,000 | -- | |
| Bulley Stacie D | -- | -- | |
| Bulley Stacie D | -- | -- | |
| Bulley David A | $106,500 | -- | |
| Bulley David A | $106,500 | -- | |
| Gallant Donald E | $84,500 | -- | |
| Gallant Donald E | $84,500 | -- |
Source: Public Records
Mortgage History
| Date | Status | Borrower | Loan Amount |
|---|---|---|---|
| Open | Obrien Martin J | $142,348 | |
| Closed | Gallant Donald E | $142,348 | |
| Previous Owner | Gallant Donald E | $85,200 |
Source: Public Records
Tax History
| Year | Tax Paid | Tax Assessment Tax Assessment Total Assessment is a certain percentage of the fair market value that is determined by local assessors to be the total taxable value of land and additions on the property. | Land | Improvement |
|---|---|---|---|---|
| 2025 | $4,290 | $219,300 | $80,300 | $139,000 |
| 2024 | $4,194 | $205,700 | $68,400 | $137,300 |
| 2023 | $3,816 | $194,200 | $68,400 | $125,800 |
| 2022 | $3,971 | $177,900 | $68,500 | $109,400 |
| 2021 | $3,855 | $166,000 | $72,400 | $93,600 |
| 2020 | $3,726 | $162,500 | $72,400 | $90,100 |
| 2019 | $3,204 | $143,300 | $63,000 | $80,300 |
| 2018 | $3,151 | $140,500 | $61,800 | $78,700 |
| 2017 | $3,053 | $140,500 | $61,800 | $78,700 |
| 2016 | $3,051 | $139,900 | $61,800 | $78,100 |
| 2015 | $3,118 | $138,500 | $63,400 | $75,100 |
| 2014 | $2,850 | $138,800 | $63,400 | $75,400 |
Source: Public Records
Map
Nearby Homes
- 85 Verde Dr
- 151 Smead Hill Rd
- 108 Nelson Rd
- 402 Country Side Rd
- 306 Country Side Rd
- 77 Summer St
- 171 Cleveland St
- 001 Adams Rd
- 37 Cleveland St
- 173-175 Conway St
- 539 Fox Hill Rd
- 111 South St
- 59-61 Conway St
- 11 Conway St
- 11 Colrain St
- 108 Colrain Shelburne Rd
- 0 Fox Hill Rd Unit 73477185
- 83 Newton St
- 23 Robbins Rd
- 0 Frizzell Hill Rd Unit 73493472
Your Personal Tour Guide
Ask me questions while you tour the home.