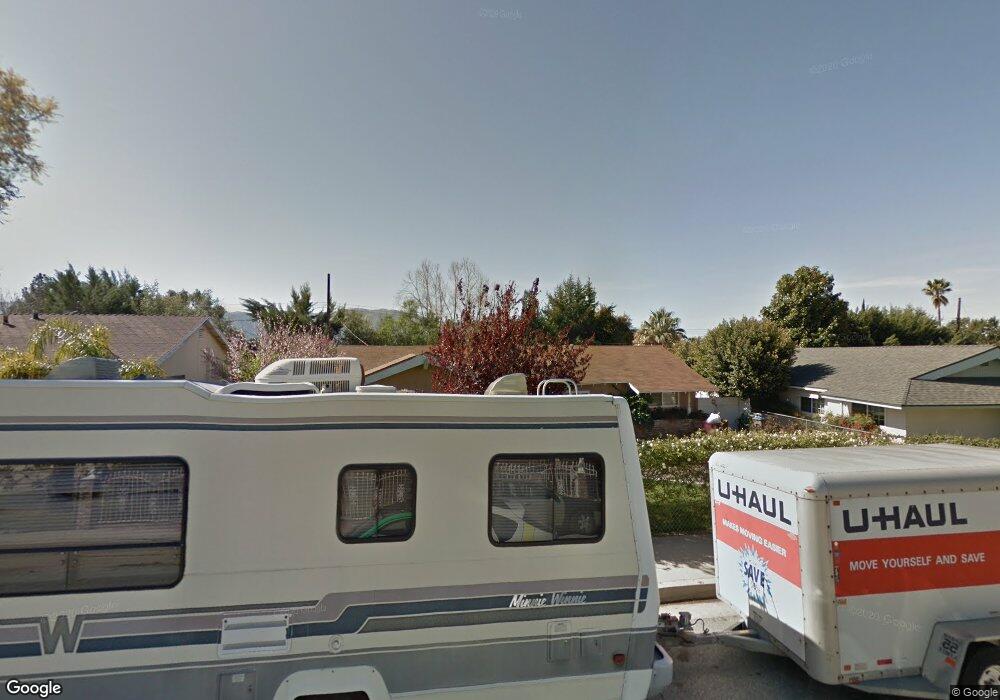
604 Pendleton Rd Banning, CA 92220
Estimated Value: $356,000 - $465,000
4
Beds
2
Baths
1,512
Sq Ft
$264/Sq Ft
Est. Value
About This Home
This home is located at 604 Pendleton Rd, Banning, CA 92220 and is currently estimated at $399,197, approximately $264 per square foot. 604 Pendleton Rd is a home located in Riverside County with nearby schools including Banning High School and Young Scholar Education Center.
Ownership History
Date
Name
Owned For
Owner Type
Purchase Details
Closed on
Oct 12, 2012
Sold by
Salas Christina
Bought by
Salas Christina Louise and Christina Louise Salas Declaration Of Tr
Current Estimated Value
Purchase Details
Closed on
Mar 20, 2010
Sold by
Salas Brenda
Bought by
Salas Christina
Purchase Details
Closed on
Jan 14, 2010
Sold by
Salas Christina
Bought by
Salas Brenda
Purchase Details
Closed on
Apr 3, 2006
Sold by
Salas Mary Louise
Bought by
Salas Brenda and Salas Christina
Purchase Details
Closed on
Jun 12, 2000
Sold by
Syring Donald A & June M 1993 Trust and June M
Bought by
Salas Joe C and Salas Mary Louise
Home Financials for this Owner
Home Financials are based on the most recent Mortgage that was taken out on this home.
Original Mortgage
$80,000
Interest Rate
10.35%
Create a Home Valuation Report for This Property
The Home Valuation Report is an in-depth analysis detailing your home's value as well as a comparison with similar homes in the area
Home Values in the Area
Average Home Value in this Area
Purchase History
| Date | Buyer | Sale Price | Title Company |
|---|---|---|---|
| Salas Christina Louise | -- | None Available | |
| Salas Christina | -- | None Available | |
| Salas Brenda | -- | None Available | |
| Salas Brenda | -- | None Available | |
| Salas Joe C | $110,000 | Chicago Title Co |
Source: Public Records
Mortgage History
| Date | Status | Borrower | Loan Amount |
|---|---|---|---|
| Previous Owner | Salas Joe C | $80,000 |
Source: Public Records
Tax History
| Year | Tax Paid | Tax Assessment Tax Assessment Total Assessment is a certain percentage of the fair market value that is determined by local assessors to be the total taxable value of land and additions on the property. | Land | Improvement |
|---|---|---|---|---|
| 2025 | $2,079 | $149,715 | $27,097 | $122,618 |
| 2023 | $2,079 | $143,903 | $26,046 | $117,857 |
| 2022 | $2,035 | $141,083 | $25,536 | $115,547 |
| 2021 | $1,996 | $138,318 | $25,036 | $113,282 |
| 2020 | $1,978 | $136,901 | $24,780 | $112,121 |
| 2019 | $1,947 | $134,218 | $24,295 | $109,923 |
| 2018 | $1,934 | $131,587 | $23,819 | $107,768 |
| 2017 | $1,903 | $129,007 | $23,352 | $105,655 |
| 2016 | $1,810 | $126,479 | $22,895 | $103,584 |
| 2015 | $1,784 | $124,581 | $22,552 | $102,029 |
| 2014 | $1,773 | $122,143 | $22,111 | $100,032 |
Source: Public Records
Map
Nearby Homes
- 546 W Indian School Ln
- 555 W Indian School Ln
- 619 W Gilman St
- 435 W Indian School Ln
- 291 Jennifer Way
- 0 W Indian School Ln
- 1087 N 1st St
- 906 N 4th St
- 34 W Gilman St
- 2400 BLK N San Gorgonio Ave
- 0 N San Gorgonio Ave
- 0 W King St Unit IV25225461
- 0 W King St Unit IV25225455
- 0 W King St Unit IV25225460
- 0 W King St Unit IV25225459
- 0 W Gilman St Unit TR25220275
- 80 E Theodore St
- 1078 W King St
- 958 N 1st St
- 1318 Horned Owl St
- 624 Pendleton Rd
- 582 Pendleton Rd
- 642 Pendleton Rd
- 558 Pendleton Rd
- 601 W Gilman St
- 603 Pendleton Rd
- 581 Pendleton Rd
- 637 Pendleton Rd
- 658 Pendleton Rd
- 538 Pendleton Rd
- 559 Pendleton Rd
- 672 Pendleton Rd
- 626 W Indian School Ln
- 606 W Indian School Ln
- 539 Pendleton Rd
- 518 Pendleton Rd
- 529 Roosevelt Rd
- 584 W Indian School Ln
- 648 W Indian School Ln
- 1376 Hibiscus Ct
Your Personal Tour Guide
Ask me questions while you tour the home.