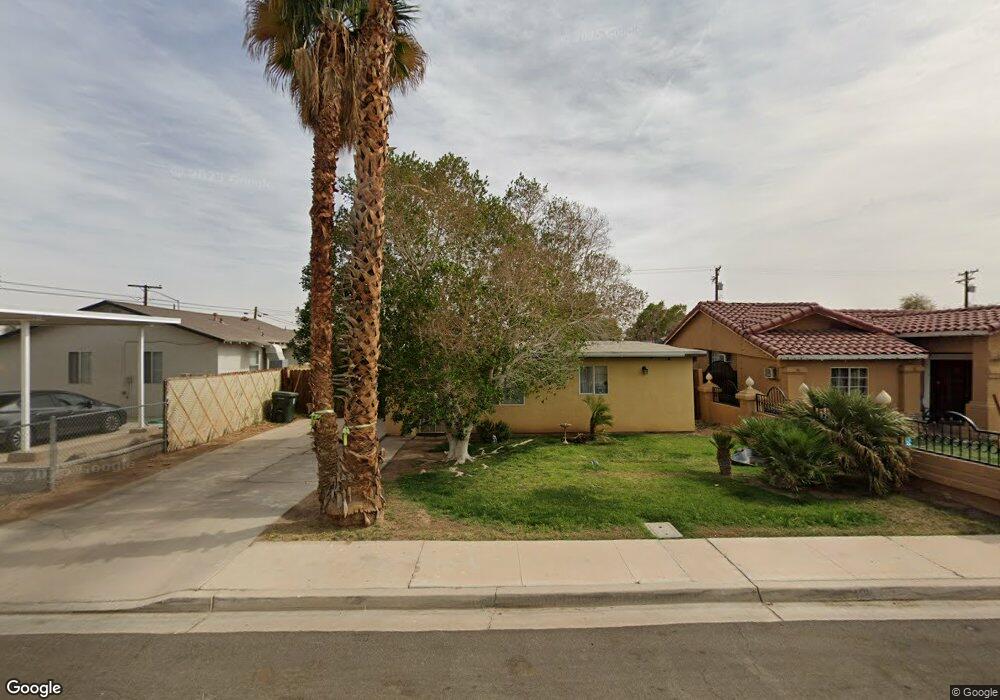
604 S E St Imperial, CA 92251
Estimated Value: $199,127 - $267,000
2
Beds
1
Bath
630
Sq Ft
$383/Sq Ft
Est. Value
About This Home
This home is located at 604 S E St, Imperial, CA 92251 and is currently estimated at $241,532, approximately $383 per square foot. 604 S E St is a home located in Imperial County with nearby schools including Ben Hulse Elementary School, Frank M. Wright Middle School, and Imperial High School.
Ownership History
Date
Name
Owned For
Owner Type
Purchase Details
Closed on
Dec 5, 2012
Sold by
Lopez Victor M
Bought by
Lopez Cindy
Current Estimated Value
Purchase Details
Closed on
Feb 22, 2005
Sold by
Lopez Cindy G
Bought by
Lopez Victor M
Home Financials for this Owner
Home Financials are based on the most recent Mortgage that was taken out on this home.
Original Mortgage
$104,000
Outstanding Balance
$63,584
Interest Rate
8.99%
Mortgage Type
Fannie Mae Freddie Mac
Estimated Equity
$177,948
Create a Home Valuation Report for This Property
The Home Valuation Report is an in-depth analysis detailing your home's value as well as a comparison with similar homes in the area
Purchase History
| Date | Buyer | Sale Price | Title Company |
|---|---|---|---|
| Lopez Cindy | -- | None Available | |
| Lopez Victor M | -- | Commonwealth Land Title | |
| Lopez Victor M | $130,000 | Commonwealth Land Title Co |
Source: Public Records
Mortgage History
| Date | Status | Borrower | Loan Amount |
|---|---|---|---|
| Open | Lopez Victor M | $104,000 |
Source: Public Records
Tax History
| Year | Tax Paid | Tax Assessment Tax Assessment Total Assessment is a certain percentage of the fair market value that is determined by local assessors to be the total taxable value of land and additions on the property. | Land | Improvement |
|---|---|---|---|---|
| 2025 | $343 | $30,863 | $8,512 | $22,351 |
| 2023 | $343 | $29,667 | $8,183 | $21,484 |
| 2022 | $336 | $29,086 | $8,023 | $21,063 |
| 2021 | $331 | $28,516 | $7,866 | $20,650 |
| 2020 | $328 | $28,225 | $7,786 | $20,439 |
| 2019 | $324 | $27,673 | $7,634 | $20,039 |
| 2018 | $320 | $27,132 | $7,485 | $19,647 |
| 2017 | $301 | $26,601 | $7,339 | $19,262 |
| 2016 | $291 | $26,081 | $7,196 | $18,885 |
| 2015 | $294 | $25,690 | $7,088 | $18,602 |
| 2014 | $275 | $25,188 | $6,950 | $18,238 |
Source: Public Records
Map
Nearby Homes
- 717 S E St
- 713 S G St
- 405 S E St
- 704 S H St
- 120 W 5th St
- 0 N Imperial Ave
- 73 Redwood
- 0 Newside 39a Unit 25618949IC
- 501 S P St
- 509 N Imperial Ave
- 0 S P St
- 2575 Clark Rd
- 0 Lee Rd
- 623 Bahia St
- 601 E 10th St
- 220 W 14th St
- 642 W Brewer Rd Unit 103
- 913 Fieldbrook Ct Unit 1
- 101 W 14th St Unit 105
- 657 Cactus St Unit 2
Your Personal Tour Guide
Ask me questions while you tour the home.