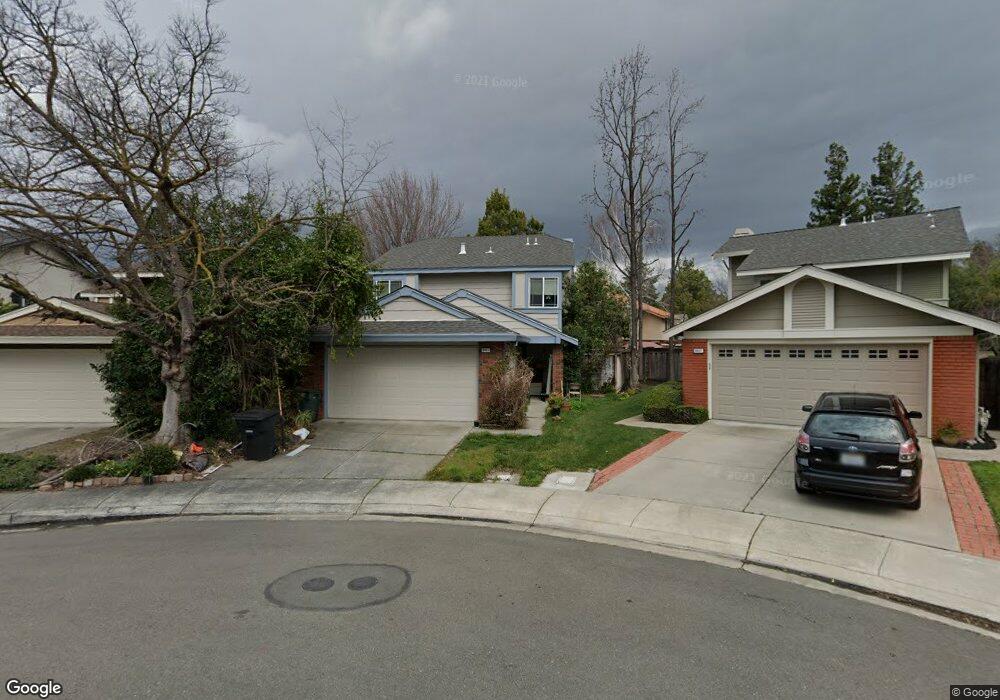
6043 Corte Encinas Pleasanton, CA 94566
Valley Trails NeighborhoodEstimated Value: $1,415,000 - $1,642,000
4
Beds
3
Baths
1,838
Sq Ft
$829/Sq Ft
Est. Value
About This Home
This home is located at 6043 Corte Encinas, Pleasanton, CA 94566 and is currently estimated at $1,523,263, approximately $828 per square foot. 6043 Corte Encinas is a home located in Alameda County with nearby schools including Donlon Elementary School, Thomas S. Hart Middle School, and Foothill High School.
Ownership History
Date
Name
Owned For
Owner Type
Purchase Details
Closed on
Oct 20, 2001
Sold by
Zhou Shun Fa and Chang Cynthia X
Bought by
Zhou Shun Fa and Chang Cynthia X
Current Estimated Value
Home Financials for this Owner
Home Financials are based on the most recent Mortgage that was taken out on this home.
Original Mortgage
$240,000
Outstanding Balance
$93,601
Interest Rate
6.84%
Estimated Equity
$1,429,662
Purchase Details
Closed on
Apr 1, 1997
Sold by
Devore John W and Devore Dorothy J
Bought by
Zhou Shun Fa and Zhang Xin
Home Financials for this Owner
Home Financials are based on the most recent Mortgage that was taken out on this home.
Original Mortgage
$214,600
Interest Rate
7.86%
Mortgage Type
Balloon
Purchase Details
Closed on
Jun 24, 1994
Sold by
Medeiros David Jeffrey
Bought by
Devore John W and Devore Dorothy J
Home Financials for this Owner
Home Financials are based on the most recent Mortgage that was taken out on this home.
Original Mortgage
$230,400
Interest Rate
5.75%
Create a Home Valuation Report for This Property
The Home Valuation Report is an in-depth analysis detailing your home's value as well as a comparison with similar homes in the area
Home Values in the Area
Average Home Value in this Area
Purchase History
| Date | Buyer | Sale Price | Title Company |
|---|---|---|---|
| Zhou Shun Fa | -- | Commonwealth Land Title Co | |
| Zhou Shun Fa | $272,000 | First American Title Guarant | |
| Devore John W | $256,000 | North American Title Company |
Source: Public Records
Mortgage History
| Date | Status | Borrower | Loan Amount |
|---|---|---|---|
| Open | Zhou Shun Fa | $240,000 | |
| Closed | Zhou Shun Fa | $214,600 | |
| Previous Owner | Devore John W | $230,400 |
Source: Public Records
Tax History Compared to Growth
Tax History
| Year | Tax Paid | Tax Assessment Tax Assessment Total Assessment is a certain percentage of the fair market value that is determined by local assessors to be the total taxable value of land and additions on the property. | Land | Improvement |
|---|---|---|---|---|
| 2025 | $5,092 | $435,975 | $132,892 | $310,083 |
| 2024 | $5,092 | $427,291 | $130,287 | $304,004 |
| 2023 | $5,031 | $425,777 | $127,733 | $298,044 |
| 2022 | $4,766 | $410,430 | $125,229 | $292,201 |
| 2021 | $4,643 | $402,245 | $122,773 | $286,472 |
| 2020 | $4,583 | $405,051 | $121,515 | $283,536 |
| 2019 | $4,636 | $397,111 | $119,133 | $277,978 |
| 2018 | $4,542 | $389,327 | $116,798 | $272,529 |
| 2017 | $4,425 | $381,694 | $114,508 | $267,186 |
| 2016 | $4,081 | $374,211 | $112,263 | $261,948 |
| 2015 | $4,005 | $368,591 | $110,577 | $258,014 |
| 2014 | $4,074 | $361,373 | $108,412 | $252,961 |
Source: Public Records
Map
Nearby Homes
- 6056 Corte Encinas
- 5988 Corte Cerritos
- 6083 Corte Montanas
- 5995 Via Del Cielo
- 6450 Calle Esperanza
- 3162 Paseo Robles
- 6686 Via San Blas
- 3530 Carlsbad Ct
- 3110 Paseo Robles
- 5550 Black Ave
- 2545 Corte Rivera
- 3636 Shenandoah Ct
- 3702 Gettysburg Ct N
- 5522 Corte Del Cajon
- 1582 Calle Enrique
- 5254 Ridgevale Way
- 1550 Calle Enrique
- 2320 Sandpiper Way
- 6355 Singletree Way
- 7444 Pecan Ct
- 6049 Corte Encinas
- 6037 Corte Encinas
- 5940 Corte Cerritos
- 6055 Corte Encinas
- 5948 Corte Cerritos
- 6031 Corte Encinas
- 5932 Corte Cerritos
- 6061 Corte Encinas
- 6061 Corte Encinas
- 6038 Corte Encinas
- 5924 Corte Cerritos
- 6067 Corte Encinas
- 6067 Corte Encinas
- 5964 Corte Cerritos
- 5956 Corte Cerritos
- 6044 Corte Encinas
- 6062 Corte Encinas
- 6050 Corte Encinas
- 5972 Corte Cerritos
- 6068 Corte Encinas