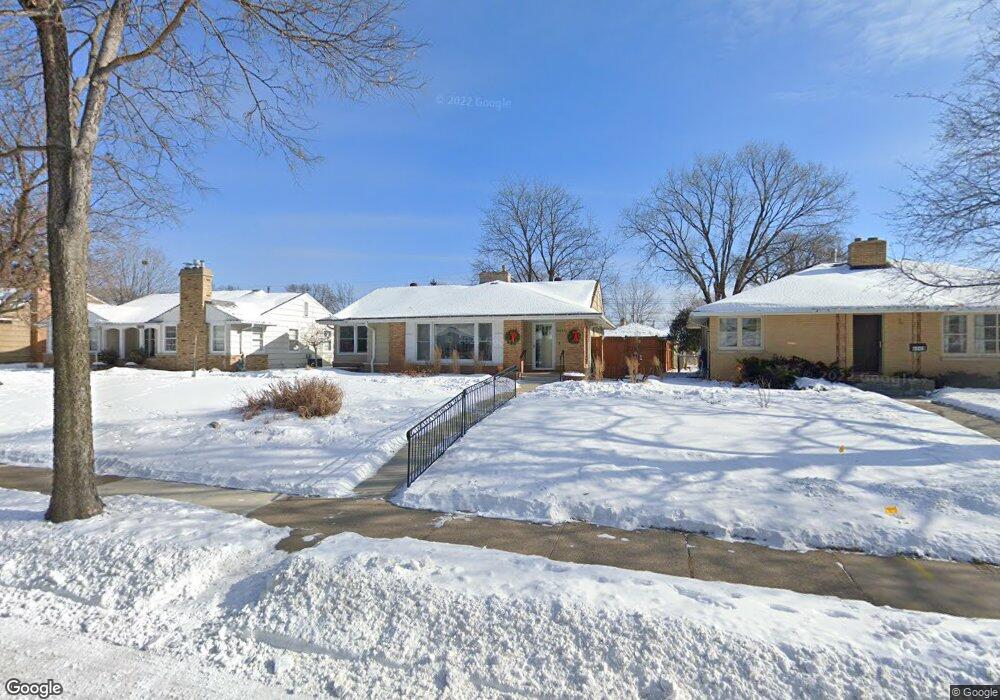
6045 Newton Ave S Minneapolis, MN 55419
Armatage NeighborhoodEstimated Value: $455,000 - $556,363
3
Beds
2
Baths
2,424
Sq Ft
$214/Sq Ft
Est. Value
About This Home
This home is located at 6045 Newton Ave S, Minneapolis, MN 55419 and is currently estimated at $518,591, approximately $213 per square foot. 6045 Newton Ave S is a home located in Hennepin County with nearby schools including Armatage Elementary School, Anthony Middle School, and Southwest Senior High School.
Ownership History
Date
Name
Owned For
Owner Type
Purchase Details
Closed on
Mar 22, 2021
Sold by
Rogers Joseph W and Lefort Ali Lara
Bought by
Rogers Joseph W and Lefort Ali Lara
Current Estimated Value
Home Financials for this Owner
Home Financials are based on the most recent Mortgage that was taken out on this home.
Original Mortgage
$412,000
Outstanding Balance
$357,201
Interest Rate
2.93%
Mortgage Type
New Conventional
Estimated Equity
$161,390
Purchase Details
Closed on
Apr 26, 2019
Sold by
Johnson Scott V
Bought by
Rogers Joseph W
Home Financials for this Owner
Home Financials are based on the most recent Mortgage that was taken out on this home.
Original Mortgage
$414,675
Interest Rate
4.3%
Mortgage Type
New Conventional
Purchase Details
Closed on
Oct 25, 2017
Sold by
Streit Joseph J and Streit Suzanne
Bought by
Johnson Scott V
Home Financials for this Owner
Home Financials are based on the most recent Mortgage that was taken out on this home.
Original Mortgage
$230,000
Interest Rate
3.85%
Mortgage Type
Commercial
Create a Home Valuation Report for This Property
The Home Valuation Report is an in-depth analysis detailing your home's value as well as a comparison with similar homes in the area
Home Values in the Area
Average Home Value in this Area
Purchase History
| Date | Buyer | Sale Price | Title Company |
|---|---|---|---|
| Rogers Joseph W | -- | Accommodation | |
| Rogers Joseph W | $436,500 | Watermark Title Agency | |
| Johnson Scott V | $287,000 | Midland Title |
Source: Public Records
Mortgage History
| Date | Status | Borrower | Loan Amount |
|---|---|---|---|
| Open | Rogers Joseph W | $412,000 | |
| Closed | Rogers Joseph W | $414,675 | |
| Previous Owner | Johnson Scott V | $230,000 |
Source: Public Records
Tax History Compared to Growth
Tax History
| Year | Tax Paid | Tax Assessment Tax Assessment Total Assessment is a certain percentage of the fair market value that is determined by local assessors to be the total taxable value of land and additions on the property. | Land | Improvement |
|---|---|---|---|---|
| 2024 | $7,376 | $499,000 | $189,000 | $310,000 |
| 2023 | $6,188 | $475,000 | $183,000 | $292,000 |
| 2022 | $6,125 | $475,000 | $159,000 | $316,000 |
| 2021 | $5,705 | $442,000 | $147,000 | $295,000 |
| 2020 | $6,178 | $426,000 | $122,000 | $304,000 |
| 2019 | $4,655 | $426,000 | $100,400 | $325,600 |
| 2018 | $4,044 | $319,000 | $100,400 | $218,600 |
| 2017 | $3,689 | $265,000 | $91,300 | $173,700 |
| 2016 | $3,567 | $251,000 | $91,300 | $159,700 |
| 2015 | $3,742 | $251,000 | $91,300 | $159,700 |
| 2014 | -- | $229,000 | $85,800 | $143,200 |
Source: Public Records
Map
Nearby Homes
- 6041 Penn Ave S
- 6107 Penn Ave S
- 1821 W 59th St
- 6015 James Ave S
- 6028 Russell Ave S
- 5812 Knox Ave S
- 5816 James Ave S
- 2616 W 60th St
- 5938 Grass Lake Terrace
- 6404 James Ave S
- 2810 W 60th St
- 6435 James Ave S
- 6412 Girard Ave S
- 5801 Fremont Ave S
- 1018 W 61st St
- 5921 Xerxes Ave S
- 5535 Penn Ave S
- 6400 Vincent Ave S
- 6449 Girard Ave S
- 5920 Colfax Ave S
- 6049 Newton Ave S
- 6041 Newton Ave S
- 6037 Newton Ave S
- 6048 Morgan Ave S
- 6044 Morgan Ave S
- 6052 Morgan Ave S
- 6040 Morgan Ave S
- 6036 Morgan Ave S
- 6040 Newton Ave S
- 6044 Newton Ave S
- 6036 Newton Ave S
- 2015 W 61st St
- 2011 W 61st St
- 2019 W 61st St
- 6032 Morgan Ave S
- 6032 Newton Ave S
- 6027 Newton Ave S
- 2007 W 61st St
- 2101 W 61st St
- 6028 Morgan Ave S