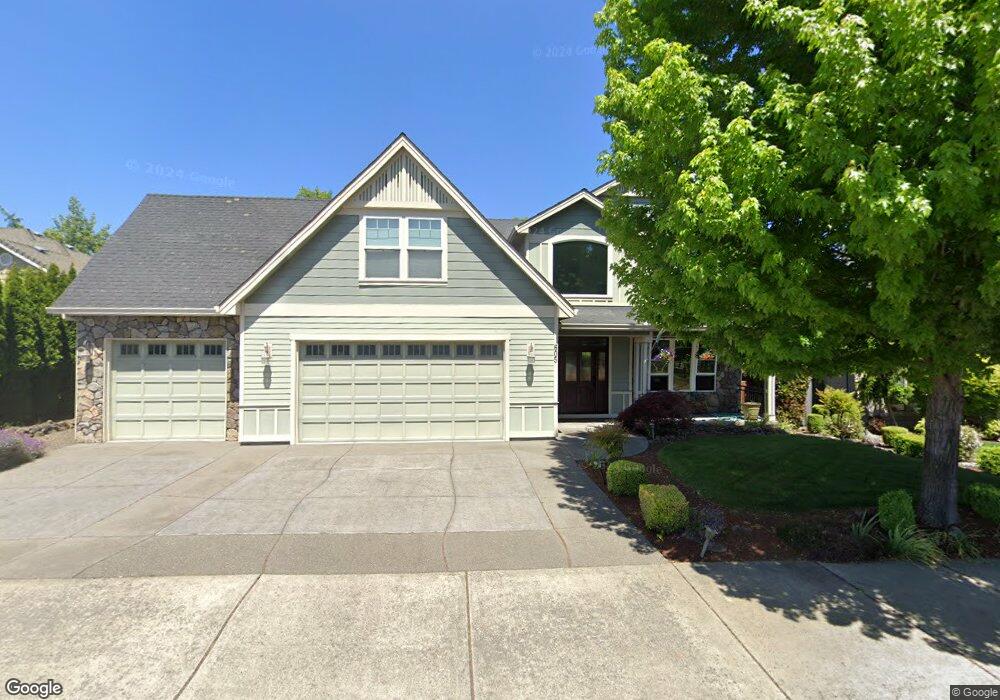
605 Arrowhead Trail Eagle Point, OR 97524
Estimated Value: $697,000 - $1,051,000
4
Beds
3
Baths
3,340
Sq Ft
$242/Sq Ft
Est. Value
About This Home
This home is located at 605 Arrowhead Trail, Eagle Point, OR 97524 and is currently estimated at $806,723, approximately $241 per square foot. 605 Arrowhead Trail is a home located in Jackson County with nearby schools including Eagle Point Middle School, White Mountain Middle School, and Eagle Point High School.
Ownership History
Date
Name
Owned For
Owner Type
Purchase Details
Closed on
Jun 25, 2008
Sold by
Bill Burfield Construction Inc
Bought by
Oehmen Tisha R
Current Estimated Value
Home Financials for this Owner
Home Financials are based on the most recent Mortgage that was taken out on this home.
Original Mortgage
$406,125
Outstanding Balance
$256,385
Interest Rate
5.99%
Mortgage Type
Purchase Money Mortgage
Estimated Equity
$550,338
Purchase Details
Closed on
Feb 2, 2007
Sold by
Noel A Moore Profit Sharing Trust
Bought by
Bill Burfield Construction Inc
Home Financials for this Owner
Home Financials are based on the most recent Mortgage that was taken out on this home.
Original Mortgage
$600,000
Interest Rate
6.17%
Mortgage Type
Seller Take Back
Purchase Details
Closed on
Mar 10, 2005
Sold by
Eagle Point Development Llc
Bought by
Noel A Moore Profit Sharing Trust
Create a Home Valuation Report for This Property
The Home Valuation Report is an in-depth analysis detailing your home's value as well as a comparison with similar homes in the area
Home Values in the Area
Average Home Value in this Area
Purchase History
| Date | Buyer | Sale Price | Title Company |
|---|---|---|---|
| Oehmen Tisha R | $541,500 | Lawyers Title Ins | |
| Bill Burfield Construction Inc | -- | Amerititle | |
| Noel A Moore Profit Sharing Trust | $696,800 | Lawyers Title Ins |
Source: Public Records
Mortgage History
| Date | Status | Borrower | Loan Amount |
|---|---|---|---|
| Open | Oehmen Tisha R | $406,125 | |
| Previous Owner | Bill Burfield Construction Inc | $600,000 |
Source: Public Records
Tax History
| Year | Tax Paid | Tax Assessment Tax Assessment Total Assessment is a certain percentage of the fair market value that is determined by local assessors to be the total taxable value of land and additions on the property. | Land | Improvement |
|---|---|---|---|---|
| 2026 | $5,523 | $405,930 | -- | -- |
| 2025 | $5,393 | $394,110 | $126,270 | $267,840 |
| 2024 | $5,393 | $382,640 | $122,600 | $260,040 |
| 2023 | $5,210 | $371,500 | $119,030 | $252,470 |
| 2022 | $5,068 | $371,500 | $119,030 | $252,470 |
| 2021 | $4,918 | $360,680 | $115,560 | $245,120 |
| 2020 | $5,224 | $350,180 | $112,200 | $237,980 |
| 2019 | $5,145 | $330,090 | $105,760 | $224,330 |
| 2018 | $5,046 | $320,480 | $102,680 | $217,800 |
| 2017 | $4,922 | $320,480 | $102,680 | $217,800 |
| 2016 | $4,827 | $302,090 | $96,790 | $205,300 |
| 2015 | $4,669 | $302,090 | $96,790 | $205,300 |
| 2014 | $4,535 | $284,760 | $91,230 | $193,530 |
Source: Public Records
Map
Nearby Homes
- 888 Arrowhead Trail
- 621 S Shasta Ave
- 936 Arrowhead Trail
- 522 Meadow Ln
- 407 S Shasta Ave
- 964 Pumpkin Ridge
- 869 St Andrews Way
- 620 S Royal Ave
- 995 Pumpkin Ridge
- 837 S Royal Ave
- 997 Arrowhead Trail
- 421 Stevens Rd Unit 20
- 421 Stevens Rd Unit 14
- 421 Stevens Rd Unit 52
- 133 Edith Cir
- 650 Sarah Ln
- 318 S Buchanan Ave
- 1043 Arrowhead Trail
- 74 Eagle View Dr
- 131 Spanish Bay Ct
- 611 Arrowhead Trail
- 599 Arrowhead Trail
- 55 Crestview Ct
- 617 Arrowhead Trail
- 49 Crestview Ct
- 593 Arrowhead Trail
- 43 Crestview Ct
- 452 Arrowhead Trail Unit 516
- 61 Crestview Ct
- 117 Pebble Creek Dr
- 427 Rodale Dr
- 623 Arrowhead Trail
- 471 Arrowhead Trail Unit 514
- 471 Arrowhead Trail
- 101 Pebble Creek Dr
- 112 Pebble Creek Dr
- 424 Rodale Dr
- 60 Crestview Ct
- 458 Arrowhead Trail Unit 515
- 629 Arrowhead Trail
Your Personal Tour Guide
Ask me questions while you tour the home.