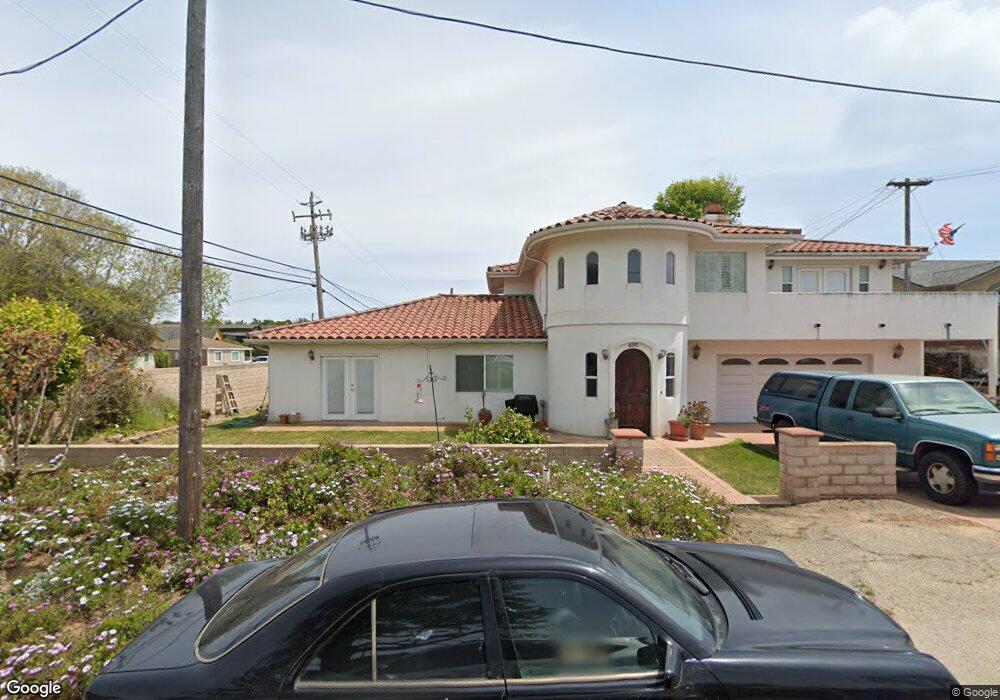
605 Bayview Ln Arroyo Grande, CA 93420
Estimated Value: $949,028 - $1,255,000
4
Beds
3
Baths
2,462
Sq Ft
$448/Sq Ft
Est. Value
About This Home
This home is located at 605 Bayview Ln, Arroyo Grande, CA 93420 and is currently estimated at $1,103,507, approximately $448 per square foot. 605 Bayview Ln is a home located in San Luis Obispo County with nearby schools including Oceano Elementary School, Mesa Middle School, and Nipomo High School.
Ownership History
Date
Name
Owned For
Owner Type
Purchase Details
Closed on
Feb 11, 2003
Sold by
Pengilley Steven and Pengilley Ayndrea
Bought by
Pengilley Steven and Pengilley Ayndrea
Current Estimated Value
Home Financials for this Owner
Home Financials are based on the most recent Mortgage that was taken out on this home.
Original Mortgage
$200,000
Interest Rate
5.89%
Purchase Details
Closed on
Jan 10, 1997
Sold by
Pengilley Steven and Pengilley Ayndrea
Bought by
Pengilley Steven and Pengilley Ayndrea
Home Financials for this Owner
Home Financials are based on the most recent Mortgage that was taken out on this home.
Original Mortgage
$110,430
Interest Rate
7.53%
Mortgage Type
FHA
Purchase Details
Closed on
Jan 7, 1997
Sold by
Bolterman David and Bolterman Clarence
Bought by
Pengilley Steven and Pengilley Ayndrea
Home Financials for this Owner
Home Financials are based on the most recent Mortgage that was taken out on this home.
Original Mortgage
$110,430
Interest Rate
7.53%
Mortgage Type
FHA
Create a Home Valuation Report for This Property
The Home Valuation Report is an in-depth analysis detailing your home's value as well as a comparison with similar homes in the area
Home Values in the Area
Average Home Value in this Area
Purchase History
| Date | Buyer | Sale Price | Title Company |
|---|---|---|---|
| Pengilley Steven | -- | Cuesta Title Company | |
| Pengilley Steven | -- | Chicago Title Co | |
| Pengilley Steven | $111,000 | Chicago Title |
Source: Public Records
Mortgage History
| Date | Status | Borrower | Loan Amount |
|---|---|---|---|
| Previous Owner | Pengilley Steven | $200,000 | |
| Previous Owner | Pengilley Steven | $110,430 |
Source: Public Records
Tax History Compared to Growth
Tax History
| Year | Tax Paid | Tax Assessment Tax Assessment Total Assessment is a certain percentage of the fair market value that is determined by local assessors to be the total taxable value of land and additions on the property. | Land | Improvement |
|---|---|---|---|---|
| 2025 | $4,475 | $435,082 | $113,991 | $321,091 |
| 2024 | $4,424 | $426,552 | $111,756 | $314,796 |
| 2023 | $4,424 | $418,189 | $109,565 | $308,624 |
| 2022 | $4,357 | $409,990 | $107,417 | $302,573 |
| 2021 | $4,349 | $401,952 | $105,311 | $296,641 |
| 2020 | $4,300 | $397,832 | $104,232 | $293,600 |
| 2019 | $4,273 | $390,033 | $102,189 | $287,844 |
| 2018 | $4,222 | $382,386 | $100,186 | $282,200 |
| 2017 | $4,143 | $374,889 | $98,222 | $276,667 |
| 2016 | $3,908 | $367,540 | $96,297 | $271,243 |
| 2015 | $3,852 | $362,020 | $94,851 | $267,169 |
| 2014 | $3,709 | $354,929 | $92,993 | $261,936 |
Source: Public Records
Map
Nearby Homes
- 765 Mesa View Dr Unit 172
- 765 Mesa View Dr Unit 86
- 765 Mesa View Dr Unit 290
- 765 Mesa View Dr
- 765 Mesa View Dr Unit 265
- 765 Mesa View Dr Unit 196
- 585 Redtail Meadow Ln
- 2610 Bayside Place
- 2535 Appaloosa Way
- 765 Mesa Dunes
- 2303 Sanderling Ct
- 2275 Plover Ct
- 740 Avocet Way
- 821 Chukar St
- 2700 Cienaga St Unit 8
- 824 Jacana Ct
- 175 Michael Ln
- 42 Cienaga St
- 1846 Via Arturo
- 2400 Cienaga St Unit 65
- 2841 S Halcyon Rd
- 611 Bayview Ln
- 2825 S Halcyon Rd
- 604 Bayview Ln
- 631 Bayview Ln
- 616 Bayview Ln
- 2807 S Halcyon Rd
- 2840 S Halcyon Rd
- 2830 S Halcyon Rd
- 2820 S Halcyon Rd
- 643 Bayview Ln
- 630 Bayview Ln
- 2860 S Halcyon Rd
- 2810 S Halcyon Rd
- 655 Bayview Ln
- 642 Bayview Ln
- 2808 S Halcyon Rd
- 620 Mesa View Dr
- 656 Bayview Ln
- 661 Bayview Ln