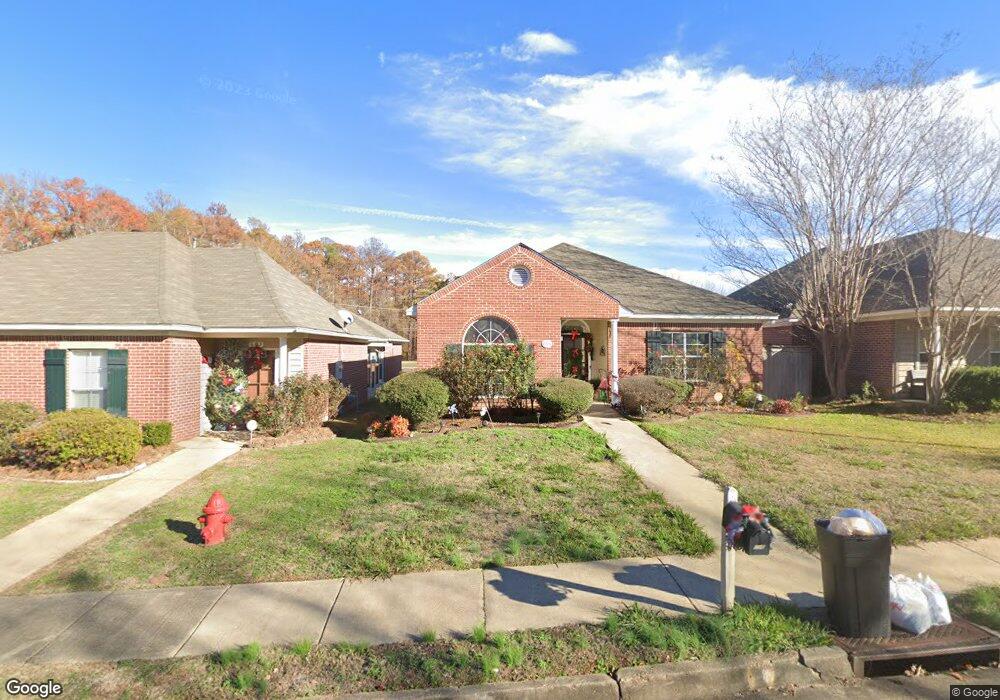
605 Camdenpark Dr Ridgeland, MS 39157
Estimated Value: $248,000 - $270,000
3
Beds
2
Baths
1,540
Sq Ft
$168/Sq Ft
Est. Value
About This Home
This home is located at 605 Camdenpark Dr, Ridgeland, MS 39157 and is currently estimated at $258,542, approximately $167 per square foot. 605 Camdenpark Dr is a home located in Madison County with nearby schools including Ann Smith Elementary School, Highland Elementary School, and Olde Towne Middle School.
Ownership History
Date
Name
Owned For
Owner Type
Purchase Details
Closed on
Jul 25, 2017
Sold by
Boutte Sarah E
Bought by
Gray Cortrinia K
Current Estimated Value
Home Financials for this Owner
Home Financials are based on the most recent Mortgage that was taken out on this home.
Original Mortgage
$166,429
Outstanding Balance
$139,725
Interest Rate
4.19%
Mortgage Type
FHA
Estimated Equity
$118,817
Purchase Details
Closed on
Feb 26, 2016
Sold by
Colunga Norma Jean and Colunga Ronald Roger
Bought by
Boutte Sarah E
Purchase Details
Closed on
Oct 25, 2014
Sold by
Deemer William Murray
Bought by
Colunga Norma Jean and Colunga Ronald Roger
Home Financials for this Owner
Home Financials are based on the most recent Mortgage that was taken out on this home.
Original Mortgage
$150,818
Interest Rate
4.29%
Mortgage Type
VA
Purchase Details
Closed on
Feb 4, 2009
Sold by
Deemer Mary Cranwell
Bought by
Deemer William Murray
Create a Home Valuation Report for This Property
The Home Valuation Report is an in-depth analysis detailing your home's value as well as a comparison with similar homes in the area
Home Values in the Area
Average Home Value in this Area
Purchase History
| Date | Buyer | Sale Price | Title Company |
|---|---|---|---|
| Gray Cortrinia K | -- | None Available | |
| Boutte Sarah E | -- | None Available | |
| Colunga Norma Jean | -- | None Available | |
| Deemer William Murray | -- | None Available |
Source: Public Records
Mortgage History
| Date | Status | Borrower | Loan Amount |
|---|---|---|---|
| Open | Gray Cortrinia K | $166,429 | |
| Previous Owner | Colunga Norma Jean | $150,818 |
Source: Public Records
Tax History Compared to Growth
Tax History
| Year | Tax Paid | Tax Assessment Tax Assessment Total Assessment is a certain percentage of the fair market value that is determined by local assessors to be the total taxable value of land and additions on the property. | Land | Improvement |
|---|---|---|---|---|
| 2024 | $1,340 | $15,219 | $0 | $0 |
| 2023 | $1,286 | $14,719 | $0 | $0 |
| 2022 | $1,286 | $14,719 | $0 | $0 |
| 2021 | $1,229 | $14,185 | $0 | $0 |
| 2020 | $1,227 | $14,174 | $0 | $0 |
| 2019 | $1,227 | $14,174 | $0 | $0 |
| 2018 | $1,227 | $14,174 | $0 | $0 |
| 2017 | $2,257 | $20,943 | $0 | $0 |
| 2016 | $2,257 | $20,943 | $0 | $0 |
| 2015 | $2,257 | $20,943 | $0 | $0 |
| 2014 | $1,205 | $13,962 | $0 | $0 |
Source: Public Records
Map
Nearby Homes
- 603 Camdenpark Dr
- 603 Arbour Ct
- 628 Kinsington Ct
- 614 Kinsington Ct
- 614 Eastwyck Dr
- 701 Napoleon Ct
- 550 Heatherstone Ct
- 771 Versailles Dr
- 626 Wendover Dr
- 523 Heatherstone Ct
- 524 Heatherstone Ct
- 518 Heatherstone Ct
- 402 Forest Ln
- 411 Forest Ln
- 611 Berridge Dr
- 402 Idlewoods Ln
- 6956 Old Canton Rd
- 308 Redbud Place
- 434 Autumn Creek Dr
- 425 Autumn Creek Dr
- 605 Camdenpark Dr
- 603 Camdenpark Dr
- 607 Camdenpark Dr
- 601 Camdenpark Dr
- 609 Camdenpark Dr
- 592 Camdenpark Place
- 592 Camden Park Place
- 611 Camdenpark Dr
- 606 Camdenpark Dr
- 606 Camdenpark Dr
- 596 Camdenpark Place
- 604 Camdenpark Dr
- 596 Camden Park Place
- 602 Camdenpark Dr
- 610 Camdenpark Dr
- 602 Camdenpark Dr
- 630 Camden Park Place
- 628 Camden Park Place
- 612 Camdenpark Dr
- 600 Camdenpark Dr