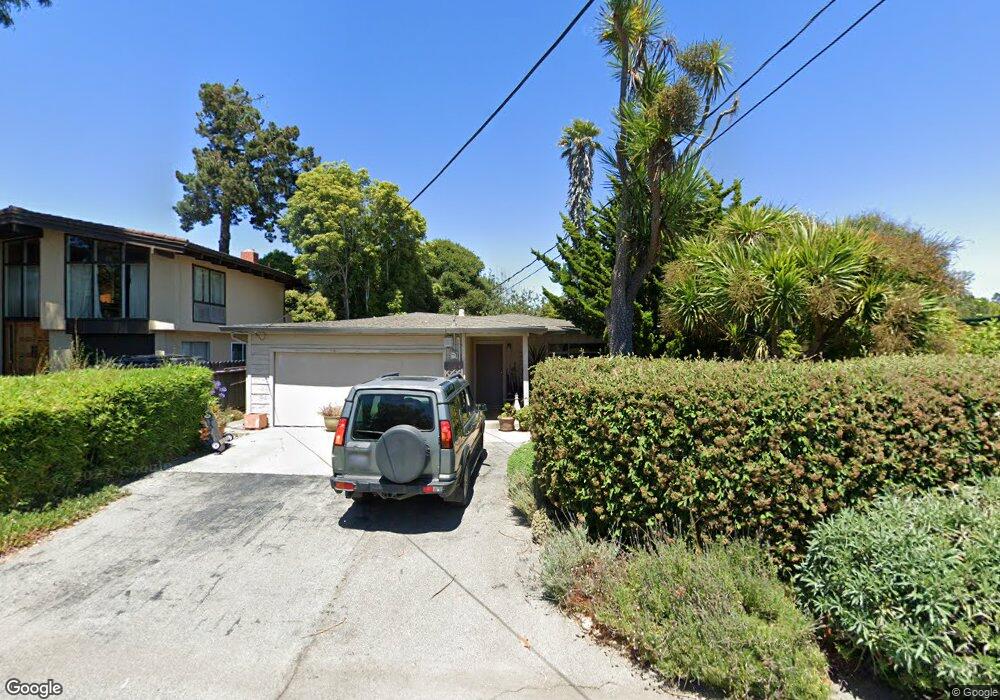
605 Cliff Dr Aptos, CA 95003
Rio del Mar NeighborhoodEstimated Value: $1,305,540 - $1,620,000
3
Beds
2
Baths
1,329
Sq Ft
$1,126/Sq Ft
Est. Value
About This Home
This home is located at 605 Cliff Dr, Aptos, CA 95003 and is currently estimated at $1,496,885, approximately $1,126 per square foot. 605 Cliff Dr is a home located in Santa Cruz County with nearby schools including Rio Del Mar Elementary School, Aptos Junior High School, and Aptos High School.
Ownership History
Date
Name
Owned For
Owner Type
Purchase Details
Closed on
Oct 10, 2024
Sold by
Ruth Ann M and Ruth Marian
Bought by
Ann M Ruth Living Trust and Ruth
Current Estimated Value
Purchase Details
Closed on
Dec 3, 2012
Sold by
Ruth Mary Lou and Ruth Family Survivors Trust
Bought by
Ruth Marian and Ruth Jonathan C
Purchase Details
Closed on
Nov 29, 2011
Sold by
Ruth Mary Lou and Ruth Charles J
Bought by
Ruth Mary Lou and Ruth Family Survivors Trust
Purchase Details
Closed on
Oct 12, 1999
Sold by
Mary Charles J and Mary Ruth
Bought by
Ruth Charles J and Ruth Mary Lou
Purchase Details
Closed on
Dec 23, 1996
Sold by
Ruth Mary Lou and Ruth Charles J
Bought by
The Ruth Family Ltd Partnership
Purchase Details
Closed on
Jun 8, 1995
Sold by
The Charles J & Mary Lou Ruth Trust
Bought by
Ruth Charles J and Ruth Mary Lou
Create a Home Valuation Report for This Property
The Home Valuation Report is an in-depth analysis detailing your home's value as well as a comparison with similar homes in the area
Home Values in the Area
Average Home Value in this Area
Purchase History
| Date | Buyer | Sale Price | Title Company |
|---|---|---|---|
| Ann M Ruth Living Trust | -- | None Listed On Document | |
| Ruth Marian | -- | None Available | |
| Ruth Mary Lou | -- | None Available | |
| Ruth Charles J | -- | -- | |
| Ruth Marian | -- | -- | |
| The Ruth Family Ltd Partnership | -- | -- | |
| Ruth Marian | -- | -- | |
| Ruth Charles J | -- | -- |
Source: Public Records
Tax History
| Year | Tax Paid | Tax Assessment Tax Assessment Total Assessment is a certain percentage of the fair market value that is determined by local assessors to be the total taxable value of land and additions on the property. | Land | Improvement |
|---|---|---|---|---|
| 2025 | $2,428 | $94,999 | $32,314 | $62,685 |
| 2023 | $2,323 | $91,311 | $31,059 | $60,252 |
| 2022 | $2,233 | $89,520 | $30,450 | $59,070 |
| 2021 | $2,048 | $87,765 | $29,853 | $57,912 |
| 2020 | $2,000 | $86,865 | $29,547 | $57,318 |
| 2019 | $1,960 | $85,161 | $28,968 | $56,193 |
| 2018 | $1,895 | $83,493 | $28,401 | $55,092 |
| 2017 | $1,864 | $81,857 | $27,846 | $54,011 |
| 2016 | $1,831 | $80,252 | $27,300 | $52,952 |
| 2015 | $1,760 | $79,046 | $26,889 | $52,157 |
| 2014 | $1,707 | $77,495 | $26,361 | $51,134 |
Source: Public Records
Map
Nearby Homes
- 105 Dunsmuir Ct Unit 1
- 619 Beach Dr
- 621 Beach Dr
- 532 Bayview Dr
- 545 Beach Dr
- 457 Townsend Dr
- 322 Arthur Ave
- 433 Seaview Dr
- 600 Saint Andrews Dr
- 607 Saint Andrews Dr
- 640 Saint Andrews Dr
- 227 Kingsbury Dr
- 424 Palmer Ave
- 320 Cliff Dr
- 615 Clubhouse Dr
- 507 La Honda Dr
- 457 Monterey Dr
- 325 Beach Dr
- 537 Santa Marguarita Dr
- 0 Loma Prieta Dr Unit ML82034156
Your Personal Tour Guide
Ask me questions while you tour the home.