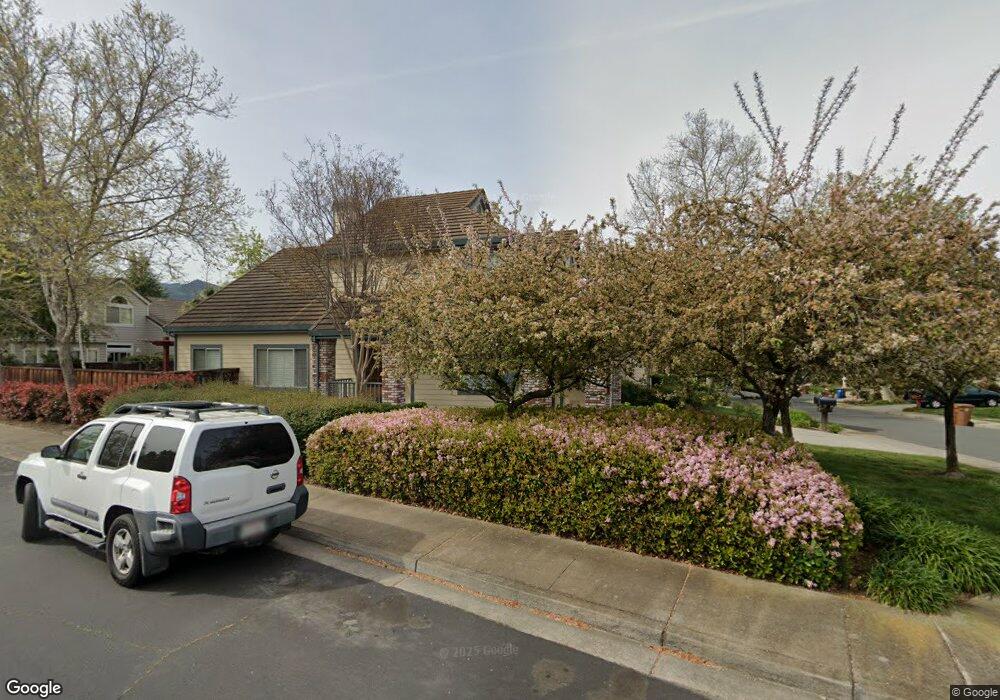
605 Julpun Loop Clayton, CA 94517
Estimated Value: $654,296 - $701,000
2
Beds
2
Baths
1,235
Sq Ft
$546/Sq Ft
Est. Value
About This Home
This home is located at 605 Julpun Loop, Clayton, CA 94517 and is currently estimated at $674,324, approximately $546 per square foot. 605 Julpun Loop is a home located in Contra Costa County with nearby schools including Mt. Diablo Elementary School, Diablo View Middle School, and College Park High School.
Ownership History
Date
Name
Owned For
Owner Type
Purchase Details
Closed on
Nov 28, 2018
Sold by
Scovill Dale D and Werner Dianne L
Bought by
Scovill Dale D and Werner Dianne L
Current Estimated Value
Purchase Details
Closed on
Nov 14, 2018
Sold by
Scovill Dale D and Werner Dianne L
Bought by
Werner Dianne L and Scovill Dale D
Purchase Details
Closed on
Aug 14, 2007
Sold by
Werner Dianne L
Bought by
Scovill Dale D and Werner Dianne L
Purchase Details
Closed on
Jul 11, 2000
Sold by
Atkinson Steven M
Bought by
Werner Dianne L
Purchase Details
Closed on
Mar 10, 1998
Sold by
Stranahan Patrick C
Bought by
Atkinson Steven M
Home Financials for this Owner
Home Financials are based on the most recent Mortgage that was taken out on this home.
Original Mortgage
$149,100
Interest Rate
7.02%
Mortgage Type
Purchase Money Mortgage
Purchase Details
Closed on
Jun 13, 1997
Sold by
John Veraces
Bought by
Stranahan Patrick C
Create a Home Valuation Report for This Property
The Home Valuation Report is an in-depth analysis detailing your home's value as well as a comparison with similar homes in the area
Home Values in the Area
Average Home Value in this Area
Purchase History
| Date | Buyer | Sale Price | Title Company |
|---|---|---|---|
| Scovill Dale D | -- | None Available | |
| Werner Dianne L | -- | None Available | |
| Scovill Dale D | -- | None Available | |
| Werner Dianne L | $260,000 | Fidelity National Title Co | |
| Atkinson Steven M | $180,000 | North American Title Co | |
| Stranahan Patrick C | $90,000 | -- |
Source: Public Records
Mortgage History
| Date | Status | Borrower | Loan Amount |
|---|---|---|---|
| Previous Owner | Atkinson Steven M | $149,100 |
Source: Public Records
Tax History
| Year | Tax Paid | Tax Assessment Tax Assessment Total Assessment is a certain percentage of the fair market value that is determined by local assessors to be the total taxable value of land and additions on the property. | Land | Improvement |
|---|---|---|---|---|
| 2025 | $5,868 | $411,041 | $217,726 | $193,315 |
| 2024 | $5,474 | $402,982 | $213,457 | $189,525 |
| 2023 | $5,474 | $395,081 | $209,272 | $185,809 |
| 2022 | $5,446 | $387,335 | $205,169 | $182,166 |
| 2021 | $5,347 | $379,742 | $201,147 | $178,595 |
| 2019 | $5,347 | $368,481 | $195,182 | $173,299 |
| 2018 | $5,150 | $361,256 | $191,355 | $169,901 |
| 2017 | $5,046 | $354,173 | $187,603 | $166,570 |
| 2016 | $4,902 | $347,229 | $183,925 | $163,304 |
| 2015 | $4,833 | $342,015 | $181,163 | $160,852 |
| 2014 | $4,741 | $335,317 | $177,615 | $157,702 |
Source: Public Records
Map
Nearby Homes
- 5617 Bettencourt Dr
- 1383 Shell Ln
- 5612 Frank Place
- 1921 Eagle Peak Ave Unit 28
- 1897 Camino Estrada
- 1421 Lydia Ln
- 1833 Camino Estrada
- 1048 Panadero Ct
- 1506 N El Camino Dr
- 5537 Pamplona Ct
- 5 Pardi Ln
- 1394 El Camino Dr
- 376 Blue Oak Ln
- 249 Stranahan Cir
- 5454 Anselmo Ct
- 5849 Mitchell Canyon Ct
- 5555 Maryland Dr
- 5817 Mitchell Canyon Ct
- 1515 Ohara Ct
- 105 Crow Place
- 609 Julpun Loop
- 601 Julpun Loop
- 615 Julpun Loop Unit 2
- 637 Julpun Loop
- 633 Julpun Loop
- 629 Julpun Loop
- 604 Julpun Loop
- 625 Julpun Loop
- 606 Julpun Loop
- 602 Julpun Loop
- 501 Suisun Ct
- 608 Julpun Loop
- 600 Julpun Loop
- 52 Karkin Place
- 1733 Indian Wells Way
- 610 Julpun Loop
- 503 Suisun Ct
- 616 Julpun Loop
- 618 Julpun Loop Unit 2
- 620 Julpun Loop
Your Personal Tour Guide
Ask me questions while you tour the home.