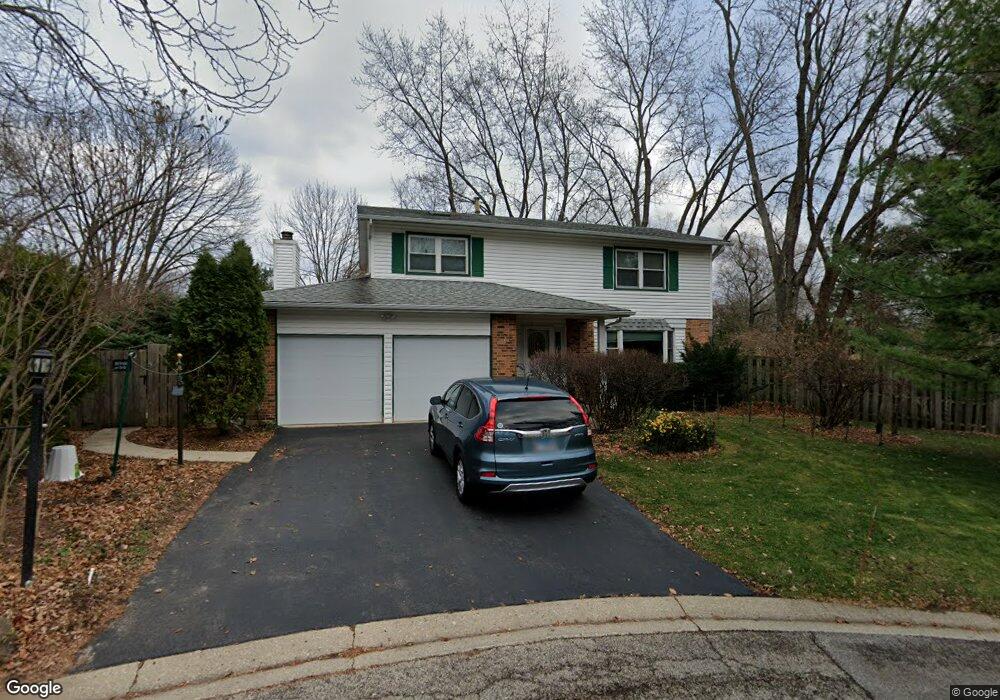
605 Mulberry Ct Unit 1 Algonquin, IL 60102
High Hill Farms NeighborhoodEstimated Value: $370,374 - $419,000
4
Beds
3
Baths
2,026
Sq Ft
$198/Sq Ft
Est. Value
About This Home
This home is located at 605 Mulberry Ct Unit 1, Algonquin, IL 60102 and is currently estimated at $401,094, approximately $197 per square foot. 605 Mulberry Ct Unit 1 is a home located in McHenry County with nearby schools including Westfield Community School, Kenneth E Neubert Elementary School, and United Junior High School.
Ownership History
Date
Name
Owned For
Owner Type
Purchase Details
Closed on
Jul 17, 1998
Sold by
Bennett Dale A and Bennett Nadine M
Bought by
Skinner James P and Skinner Cynthia A
Current Estimated Value
Home Financials for this Owner
Home Financials are based on the most recent Mortgage that was taken out on this home.
Original Mortgage
$114,000
Outstanding Balance
$23,471
Interest Rate
7.07%
Estimated Equity
$377,623
Create a Home Valuation Report for This Property
The Home Valuation Report is an in-depth analysis detailing your home's value as well as a comparison with similar homes in the area
Home Values in the Area
Average Home Value in this Area
Purchase History
| Date | Buyer | Sale Price | Title Company |
|---|---|---|---|
| Skinner James P | $177,000 | -- |
Source: Public Records
Mortgage History
| Date | Status | Borrower | Loan Amount |
|---|---|---|---|
| Open | Skinner James P | $114,000 |
Source: Public Records
Tax History Compared to Growth
Tax History
| Year | Tax Paid | Tax Assessment Tax Assessment Total Assessment is a certain percentage of the fair market value that is determined by local assessors to be the total taxable value of land and additions on the property. | Land | Improvement |
|---|---|---|---|---|
| 2024 | $7,341 | $111,848 | $25,577 | $86,271 |
| 2023 | $4,460 | $100,034 | $22,875 | $77,159 |
| 2022 | $6,823 | $92,558 | $23,497 | $69,061 |
| 2021 | $6,498 | $86,229 | $21,890 | $64,339 |
| 2020 | $6,301 | $83,176 | $21,115 | $62,061 |
| 2019 | $6,116 | $79,610 | $20,210 | $59,400 |
| 2018 | $5,365 | $73,543 | $18,670 | $54,873 |
| 2017 | $6,102 | $69,282 | $17,588 | $51,694 |
| 2016 | $5,992 | $64,980 | $16,496 | $48,484 |
| 2013 | -- | $65,923 | $15,388 | $50,535 |
Source: Public Records
Map
Nearby Homes
- 721 Brentwood Ct
- 314 Washington St
- 102 Center St
- 1235 Fairmont Ct
- 0 River Dr N Unit MRD12473279
- 266 Grandview Ct
- 1 N Hubbard St
- SWC Talaga and Algonquin Rd
- 420 N Harrison St
- 909 Roger St
- 16 Brian Ct
- 700 Fairfield Ln
- 600 E Algonquin Rd
- 809 Menominee Dr
- 807 Menominee Dr
- 710 Sprucetree Ln
- 1210 Brandywine Cir
- 937 Mesa Dr
- 2 Sunset Ln
- 900 Windstone Ct
- 615 Mulberry Ct
- 602 Evergreen Ct
- 600 Mulberry Ct
- 513 Skyline Dr
- 515 Skyline Dr
- 610 Mulberry Ct
- 511 Skyline Dr
- 519 Skyline Dr
- 625 Mulberry Ct
- 612 Evergreen Ct
- 601 Evergreen Ct
- 611 Orchard Ct
- 620 Mulberry Ct
- 601 Orchard Ct
- 621 Orchard Ct
- 509 Skyline Dr
- 521 Skyline Dr
- 611 Evergreen Ct
- 610 Huntington Ct Unit 1
- 514 Skyline Dr