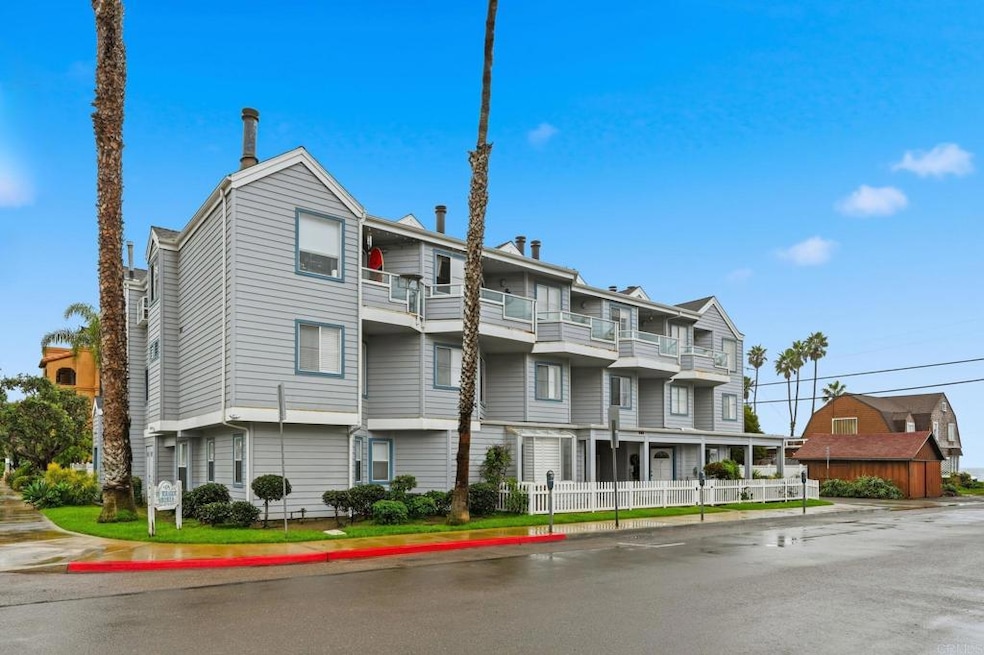
605 S Myers St Unit 1 Oceanside, CA 92054
Downtown Oceanside NeighborhoodEstimated payment $6,558/month
Highlights
- Very Popular Property
- 0.22 Acre Lot
- Bike Trail
- Ocean View
- Laundry Room
- Stacked Washer and Dryer
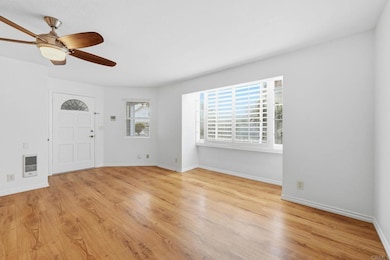
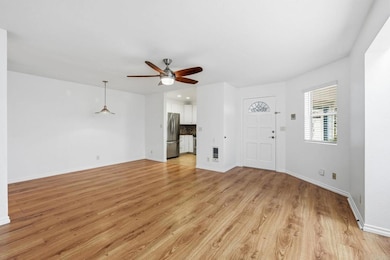
About This Home
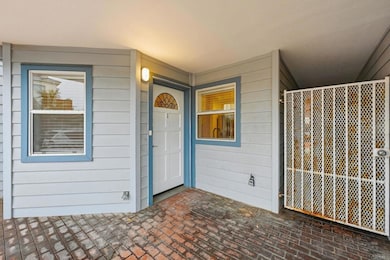
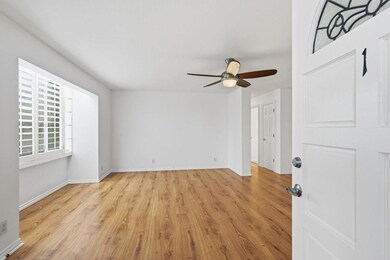
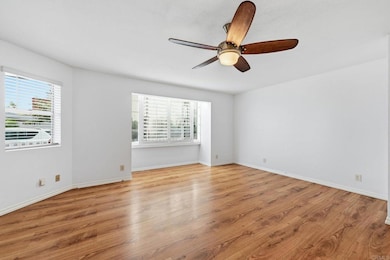
Welcome to El Mirador Shores—where coastal living meets modern comfort! Just one block from the beach, this beautifully upgraded condo offers an ideal blend of convenience and style. The open kitchen features granite countertops and stainless steel appliances, while laminate flooring flows throughout the main living areas, with carpet reserved for the bedrooms. Enjoy the ease of an in-unit stackable washer and dryer, plus two reserved gated carport parking spaces and additional storage. Both bedrooms are generously sized, and the primary suite boasts an impressively large walk-in closet. HOA dues cover water, trash, and sewer for added value and peace of mind.
Listing Agent
CPM Realty Brokerage Email: Greg@cpmrealty.us License #01710272 Listed on: 11/17/2025
Property Details
Home Type
- Condominium
Est. Annual Taxes
- $6,750
Year Built
- Built in 1988
HOA Fees
- $460 Monthly HOA Fees
Property Views
- Ocean
- City Lights
Home Design
- Entry on the 1st floor
Interior Spaces
- 1,126 Sq Ft Home
- 1-Story Property
Bedrooms and Bathrooms
- 2 Bedrooms
- 2 Full Bathrooms
Laundry
- Laundry Room
- Stacked Washer and Dryer
Parking
- 2 Parking Spaces
- 2 Carport Spaces
Additional Features
- Exterior Lighting
- Two or More Common Walls
- No Heating
Listing and Financial Details
- Tax Tract Number 11752
- Assessor Parcel Number 1502622201
- $45 per year additional tax assessments
- Seller Considering Concessions
Community Details
Overview
- 9 Units
- El Mirador HOA, Phone Number (760) 602-0221
Recreation
- Bike Trail
Map
Home Values in the Area
Average Home Value in this Area
Tax History
| Year | Tax Paid | Tax Assessment Tax Assessment Total Assessment is a certain percentage of the fair market value that is determined by local assessors to be the total taxable value of land and additions on the property. | Land | Improvement |
|---|---|---|---|---|
| 2025 | $6,750 | $611,672 | $450,710 | $160,962 |
| 2024 | $6,750 | $599,679 | $441,873 | $157,806 |
| 2023 | $6,542 | $587,921 | $433,209 | $154,712 |
| 2022 | $6,444 | $576,394 | $424,715 | $151,679 |
| 2021 | $6,469 | $565,093 | $416,388 | $148,705 |
| 2020 | $6,269 | $559,300 | $412,119 | $147,181 |
| 2019 | $6,087 | $548,335 | $404,039 | $144,296 |
| 2018 | $6,023 | $537,584 | $396,117 | $141,467 |
| 2017 | $5,913 | $527,044 | $388,350 | $138,694 |
| 2016 | $5,722 | $516,711 | $380,736 | $135,975 |
| 2015 | $5,555 | $508,950 | $375,017 | $133,933 |
| 2014 | $5,340 | $498,981 | $367,671 | $131,310 |
Property History
| Date | Event | Price | List to Sale | Price per Sq Ft |
|---|---|---|---|---|
| 11/17/2025 11/17/25 | For Sale | $1,050,000 | -- | $933 / Sq Ft |
Purchase History
| Date | Type | Sale Price | Title Company |
|---|---|---|---|
| Interfamily Deed Transfer | -- | None Available | |
| Grant Deed | $475,000 | Fidelity National Title | |
| Grant Deed | $144,000 | Southland Title | |
| Deed | $170,000 | -- | |
| Deed | $124,000 | -- | |
| Deed | $114,700 | -- |
Mortgage History
| Date | Status | Loan Amount | Loan Type |
|---|---|---|---|
| Open | $350,000 | Purchase Money Mortgage | |
| Previous Owner | $115,200 | Purchase Money Mortgage |
Source: California Regional Multiple Listing Service (CRMLS)
MLS Number: NDP2510891
APN: 150-262-22-01
Disclaimer: Certain information contained herein is derived from information provided by parties other than Homes.com. All information provided is deemed reliable, but is not guaranteed to be accurate and should be independently verified.
![]() The multiple listing data appearing on this website, or contained in reports produced therefrom, is owned and copyrighted by California Regional Multiple Listing Service, Inc. ("CRMLS") and is protected by all applicable copyright laws. Information provided is for viewer's personal, non-commercial use and may not be used for any purpose other than to identify prospective properties the viewer may be interested in purchasing. All listing data, including but not limited to square footage and lot size is believed to be accurate, but the listing Agent, listing Broker and CRMLS and its affiliates do not warrant or guarantee such accuracy. The viewer should independently verify the listed data prior to making any decisions based on such information by personal inspection and/or contacting a real estate professional.
The multiple listing data appearing on this website, or contained in reports produced therefrom, is owned and copyrighted by California Regional Multiple Listing Service, Inc. ("CRMLS") and is protected by all applicable copyright laws. Information provided is for viewer's personal, non-commercial use and may not be used for any purpose other than to identify prospective properties the viewer may be interested in purchasing. All listing data, including but not limited to square footage and lot size is believed to be accurate, but the listing Agent, listing Broker and CRMLS and its affiliates do not warrant or guarantee such accuracy. The viewer should independently verify the listed data prior to making any decisions based on such information by personal inspection and/or contacting a real estate professional.
Based on information from California Regional Multiple Listing Service, Inc. and /or other sources. All data, including all measurements and calculations of area, is obtained from various sources and has not been, and will not be, verified by broker or MLS. All information should be independently reviewed and verified for accuracy. Properties may or may not be listed by the office/agent presenting the information
- 519 S Myers St
- 506 S Pacific St
- 465 S Cleveland St Unit 103
- 432 S Cleveland St
- 834 S Pacific St
- 902-4 S Pacific St
- 212 S Pacific St
- 214 S Pacific St
- 920 S Pacific St
- 1009 S Cleveland St
- 1009 S Coast Hwy
- 1036 S Pacific St
- 1105 S Cleveland St Unit 314
- 909 Leonard Ave
- 911 Minnesota Ave
- 1123-25 S Pacific St
- 301 Mission Ave Unit 509
- 110 S Freeman St
- 301 S Horne St
- 1216 S Pacific St
- 605 S Myers St Unit 8
- 914 S Myers St
- 307 West St Unit 106
- 148 S Myers St Unit ID1292601P
- 303 S Freeman St
- 428 S Ditmar St
- 115 N Cleveland St
- 1123-25 S Pacific St
- 301 Mission Ave Unit 602
- 301 Mission Ave Unit 605
- 550 Seagaze Dr
- 250 Mission Ave
- 244 S Horne St
- 415 Grant St
- 314 N Cleveland St Unit 4
- 1220 S Ditmar St
- 1112 Hibiscus Way
- 1105 Makena Way
- 1101 Makena Way
- 1125 Makena Way
