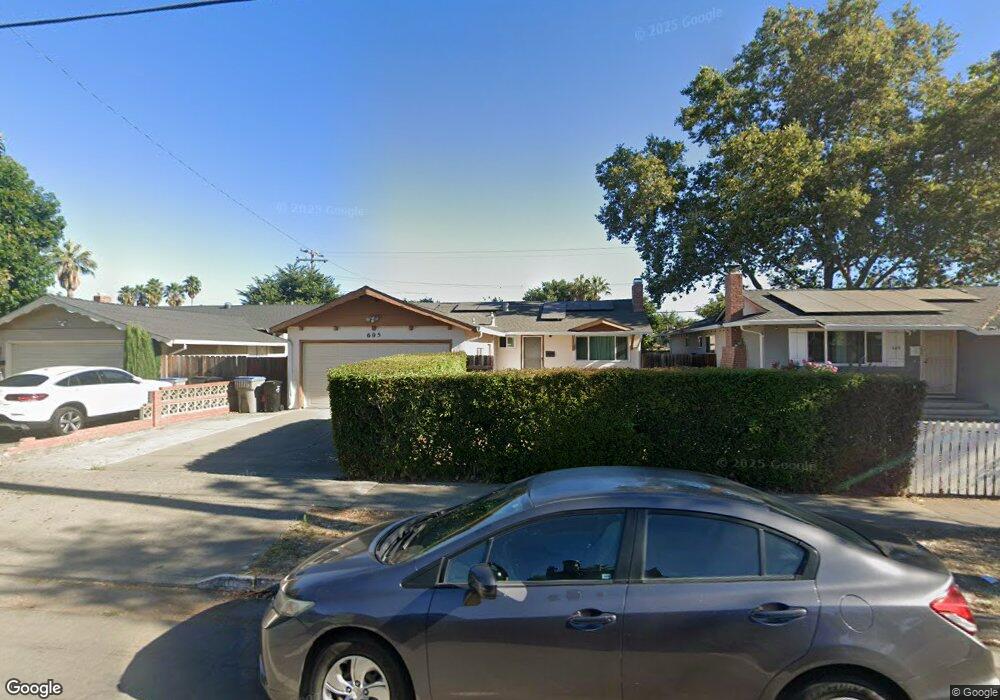
605 Sylvandale Ave San Jose, CA 95111
Hellyer NeighborhoodEstimated Value: $937,000 - $1,062,000
3
Beds
2
Baths
1,110
Sq Ft
$901/Sq Ft
Est. Value
About This Home
This home is located at 605 Sylvandale Ave, San Jose, CA 95111 and is currently estimated at $1,000,089, approximately $900 per square foot. 605 Sylvandale Ave is a home located in Santa Clara County with nearby schools including G.W. Hellyer Elementary School, Sylvandale Middle School, and Andrew P. Hill High School.
Ownership History
Date
Name
Owned For
Owner Type
Purchase Details
Closed on
Aug 27, 2021
Sold by
Haq Selina S
Bought by
Haq Mozammel and Haq Selina S
Current Estimated Value
Home Financials for this Owner
Home Financials are based on the most recent Mortgage that was taken out on this home.
Original Mortgage
$170,700
Outstanding Balance
$106,825
Interest Rate
2.17%
Estimated Equity
$893,264
Purchase Details
Closed on
Aug 26, 2021
Sold by
Haq Selina S
Bought by
Haq Selina S and Haq Selina Sultana
Home Financials for this Owner
Home Financials are based on the most recent Mortgage that was taken out on this home.
Original Mortgage
$170,700
Outstanding Balance
$106,825
Interest Rate
2.17%
Estimated Equity
$893,264
Purchase Details
Closed on
Feb 18, 2021
Sold by
Haq Mozammel
Bought by
Haq Selina S
Home Financials for this Owner
Home Financials are based on the most recent Mortgage that was taken out on this home.
Original Mortgage
$180,000
Interest Rate
2.7%
Mortgage Type
New Conventional
Purchase Details
Closed on
Feb 17, 2021
Sold by
Haq Selina S
Bought by
Haq Mozammel and Haq Selina S
Home Financials for this Owner
Home Financials are based on the most recent Mortgage that was taken out on this home.
Original Mortgage
$180,000
Interest Rate
2.7%
Mortgage Type
New Conventional
Purchase Details
Closed on
Aug 1, 2018
Sold by
Haq Mozammel and Haq Selina S
Bought by
Sultana Selina and Cselina Bassett Haq Revocable
Purchase Details
Closed on
Aug 8, 2012
Sold by
Haq Mozammel and Haq Selina S
Bought by
Haq Mozammel and Haq Selina S
Home Financials for this Owner
Home Financials are based on the most recent Mortgage that was taken out on this home.
Original Mortgage
$280,250
Interest Rate
3.49%
Mortgage Type
New Conventional
Purchase Details
Closed on
Dec 16, 2010
Sold by
Gathers Benjamin Michael
Bought by
Haq Mozammel and Haq Selina S
Home Financials for this Owner
Home Financials are based on the most recent Mortgage that was taken out on this home.
Original Mortgage
$291,080
Interest Rate
4.37%
Mortgage Type
FHA
Purchase Details
Closed on
Dec 17, 1993
Sold by
Gathers Lori Kuniko
Bought by
Gathers Benjamin Michael
Home Financials for this Owner
Home Financials are based on the most recent Mortgage that was taken out on this home.
Original Mortgage
$123,750
Interest Rate
7.2%
Create a Home Valuation Report for This Property
The Home Valuation Report is an in-depth analysis detailing your home's value as well as a comparison with similar homes in the area
Home Values in the Area
Average Home Value in this Area
Purchase History
| Date | Buyer | Sale Price | Title Company |
|---|---|---|---|
| Haq Mozammel | -- | Chicago Title Company | |
| Haq Selina S | -- | Chicago Title Company | |
| Haq Selina S | -- | Chicago Title Company | |
| Haq Selina S | -- | Chicago Title Company | |
| Haq Selina S | -- | Chicago Title Company | |
| Haq Selina S | -- | Chicago Title Company | |
| Haq Mozammel | -- | Chicago Title Company | |
| Haq Selina S | -- | Chicago Title Company | |
| Sultana Selina | -- | None Available | |
| Haq Mozammel | -- | Fidelity National Title Co | |
| Haq Mozammel | $295,000 | Fidelity National Title Co | |
| Gathers Benjamin Michael | -- | First American Title Guarant |
Source: Public Records
Mortgage History
| Date | Status | Borrower | Loan Amount |
|---|---|---|---|
| Open | Haq Selina S | $170,700 | |
| Closed | Haq Selina S | $170,700 | |
| Closed | Haq Mozammel | $180,000 | |
| Closed | Haq Mozammel | $280,250 | |
| Closed | Haq Mozammel | $291,080 | |
| Previous Owner | Gathers Benjamin Michael | $123,750 |
Source: Public Records
Tax History Compared to Growth
Tax History
| Year | Tax Paid | Tax Assessment Tax Assessment Total Assessment is a certain percentage of the fair market value that is determined by local assessors to be the total taxable value of land and additions on the property. | Land | Improvement |
|---|---|---|---|---|
| 2025 | $6,278 | $377,938 | $226,762 | $151,176 |
| 2024 | $6,278 | $370,528 | $222,316 | $148,212 |
| 2023 | $6,174 | $363,263 | $217,957 | $145,306 |
| 2022 | $6,043 | $356,141 | $213,684 | $142,457 |
| 2021 | $5,980 | $349,159 | $209,495 | $139,664 |
| 2020 | $5,740 | $345,579 | $207,347 | $138,232 |
| 2019 | $5,504 | $338,804 | $203,282 | $135,522 |
| 2018 | $5,483 | $332,162 | $199,297 | $132,865 |
| 2017 | $5,407 | $325,650 | $195,390 | $130,260 |
| 2016 | $5,141 | $319,265 | $191,559 | $127,706 |
| 2015 | $5,034 | $314,470 | $188,682 | $125,788 |
| 2014 | $4,577 | $308,310 | $184,986 | $123,324 |
Source: Public Records
Map
Nearby Homes
- 3535 Pitcairn Way
- 573 Bamboo Ct
- 3461 Senter Rd
- 491 Ginkgo Ct
- 403 Mignot Ln
- 572 Groth Dr
- 3283 Leafwood Ln
- 407 Aires Ln
- 3128 Shofner Place
- 523 Sieber Place
- 425 Carpentier Way
- 4016 San Bernardino Way
- 3814 Seven Trees Blvd
- 4219 Senter Rd
- 4171 Ambler Way
- 13014 Water St
- 96 Rancho Dr Unit B
- 171 Kenbrook Cir
- 3843 Marfrance Dr
- 3891 Marfrance Dr
- 609 Sylvandale Ave
- 601 Sylvandale Ave
- 613 Sylvandale Ave
- 3569 Pitcairn Way
- 3557 Pitcairn Way
- 3584 Senter Rd
- 3579 Pitcairn Way
- 617 Sylvandale Ave
- 3545 Pitcairn Way
- 3589 Pitcairn Way
- 3568 Senter Rd
- 3765 Chilton Ct
- 621 Sylvandale Ave
- 3599 Pitcairn Way
- 3554 Senter Rd
- 3556 Senter Rd
- 597 Hornbeam Way
- 3771 Chilton Ct
- 3570 Pitcairn Way
- 596 Crabapple Way