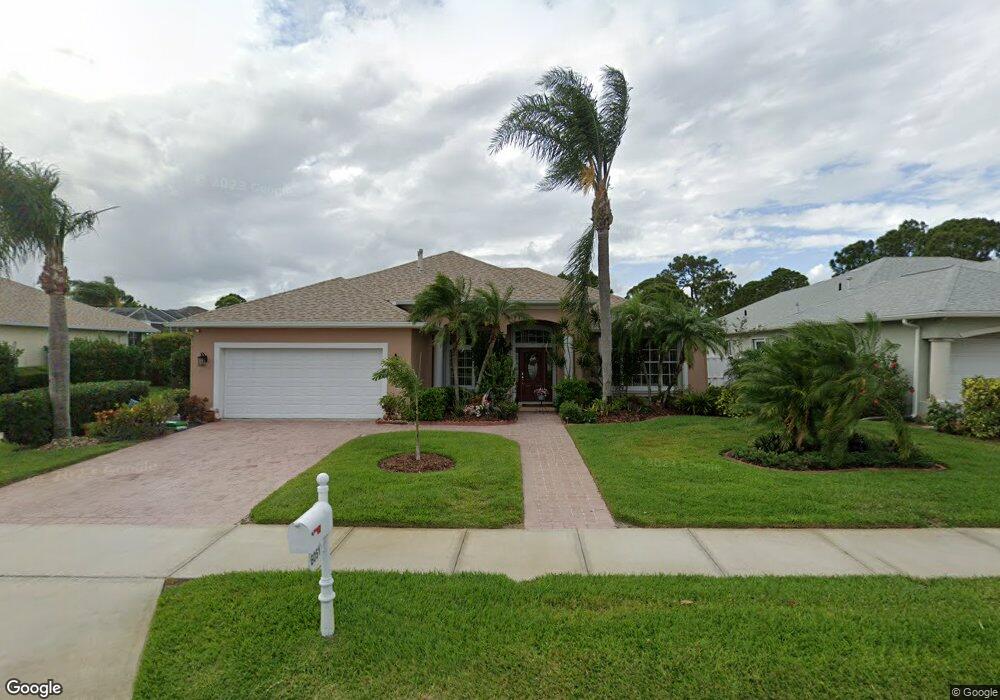
6051 Herons Landing Dr Unit 6 Rockledge, FL 32955
Estimated Value: $493,000 - $562,000
3
Beds
2
Baths
1,952
Sq Ft
$267/Sq Ft
Est. Value
About This Home
This home is located at 6051 Herons Landing Dr Unit 6, Rockledge, FL 32955 and is currently estimated at $520,455, approximately $266 per square foot. 6051 Herons Landing Dr Unit 6 is a home located in Brevard County with nearby schools including Ralph M. Williams Junior Elementary School, Ronald McNair Magnet Middle School, and Devereux School.
Ownership History
Date
Name
Owned For
Owner Type
Purchase Details
Closed on
Nov 14, 2016
Sold by
Whtie Nancy H and The Billington Family Trust
Bought by
Moorin Steve and Krol Susan
Current Estimated Value
Purchase Details
Closed on
May 10, 2016
Sold by
Billington Nancy H and The Billington Family Trust
Bought by
White Nancy H and The Billington Family Trust
Purchase Details
Closed on
May 1, 2016
Bought by
Moorin Steve
Purchase Details
Closed on
Mar 1, 2016
Bought by
Moorin Steve
Purchase Details
Closed on
Jan 27, 2004
Sold by
Billington Norbert H and Billington Petra C
Bought by
Billington Norbert H and Billington Petra C
Purchase Details
Closed on
Jan 16, 2003
Sold by
Barber Dev Corp
Bought by
Billington Norbert H and Billington Petra C
Home Financials for this Owner
Home Financials are based on the most recent Mortgage that was taken out on this home.
Original Mortgage
$209,831
Interest Rate
6.16%
Create a Home Valuation Report for This Property
The Home Valuation Report is an in-depth analysis detailing your home's value as well as a comparison with similar homes in the area
Home Values in the Area
Average Home Value in this Area
Purchase History
| Date | Buyer | Sale Price | Title Company |
|---|---|---|---|
| Moorin Steve | $220,000 | Elite Title Of The Treasure | |
| White Nancy H | -- | Attorney | |
| Moorin Steve | $100 | -- | |
| Moorin Steve | -- | -- | |
| Billington Norbert H | -- | -- | |
| Billington Norbert H | $43,000 | -- | |
| Barber Dev Corp | $43,000 | -- |
Source: Public Records
Mortgage History
| Date | Status | Borrower | Loan Amount |
|---|---|---|---|
| Previous Owner | Barber Dev Corp | $209,831 |
Source: Public Records
Tax History Compared to Growth
Tax History
| Year | Tax Paid | Tax Assessment Tax Assessment Total Assessment is a certain percentage of the fair market value that is determined by local assessors to be the total taxable value of land and additions on the property. | Land | Improvement |
|---|---|---|---|---|
| 2025 | $3,335 | $223,920 | -- | -- |
| 2024 | $3,292 | $217,610 | -- | -- |
| 2023 | $3,292 | $211,280 | $0 | $0 |
| 2022 | $3,107 | $205,130 | $0 | $0 |
| 2021 | $3,287 | $199,160 | $0 | $0 |
| 2020 | $3,275 | $196,420 | $0 | $0 |
| 2019 | $3,222 | $192,010 | $0 | $0 |
| 2018 | $3,229 | $188,430 | $0 | $0 |
| 2017 | $3,252 | $184,560 | $0 | $0 |
| 2016 | $3,294 | $181,230 | $70,000 | $111,230 |
| 2015 | $3,369 | $179,980 | $70,000 | $109,980 |
| 2014 | $3,377 | $178,560 | $65,000 | $113,560 |
Source: Public Records
Map
Nearby Homes
- 1260 Worcester Way
- 1773 Sun Gazer Dr
- 1162 Brumpton Place
- 840 Sandhill Crane Ct
- 1820 Sun Gazer Dr
- 1292 Brumpton Place
- 1841 Sun Gazer Dr
- 1715 Sun Gazer Dr
- 1307 Auburn Lakes Dr
- 5057 Bennington Place
- 5077 Templeton Place
- 1671 Lago Mar Dr
- 1790 Independence Ave
- 1505 Chesapeake Ct
- 1692 Keys Gate Dr
- 1713 Keys Gate Dr
- 1703 Keys Gate Dr
- 1464 Timacuan Dr
- 1634 Timacuan Dr
- 1422 Keys Gate Dr
- 6051 Herons Landing Dr
- 6041 Herons Landing Dr
- 6061 Herons Landing Dr
- 5957 Barn Owl Ct
- 6031 Herons Landing Dr
- 6040 Herons Landing Dr
- 6050 Herons Landing Dr
- 6060 Herons Landing Dr
- 6021 Herons Landing Dr
- 6070 Herons Landing Dr
- 6030 Herons Landing Dr Unit 6
- 5966 Barn Owl Ct
- 6080 Herons Landing Dr
- 6011 Herons Landing Dr
- 6091 Herons Landing Dr
- 6020 Herons Landing Dr
- 5956 Barn Owl Ct Unit 6
- 6090 Herons Landing Dr
- 6000 Herons Landing Dr
- 1008 Dowitcher Ct