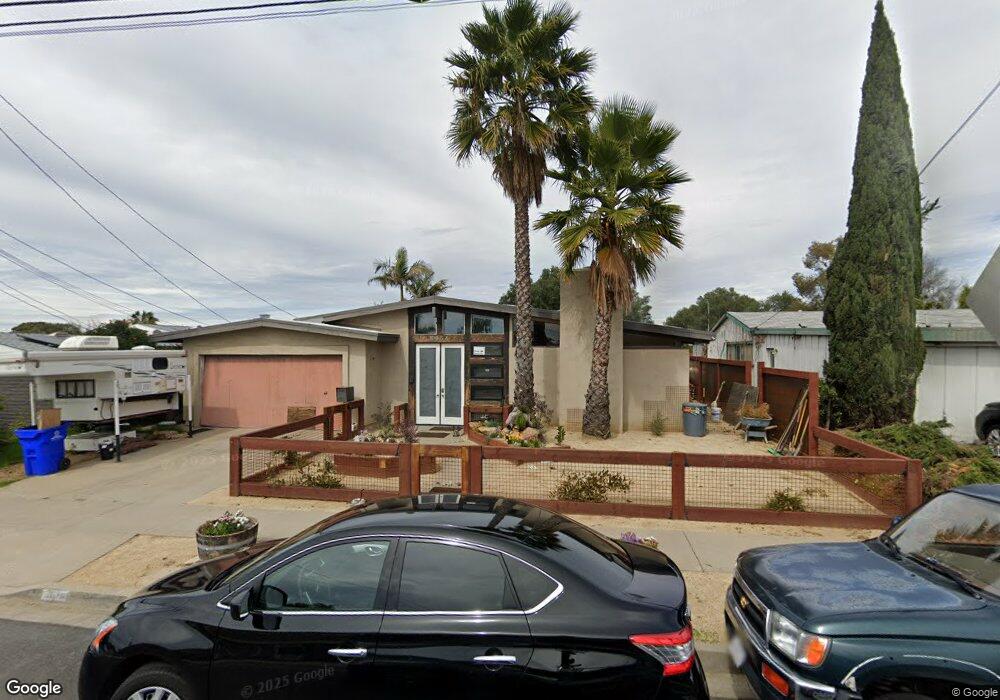
6054 Chandler Dr San Diego, CA 92117
Clairemont Mesa East NeighborhoodEstimated Value: $1,099,000 - $1,272,000
4
Beds
3
Baths
1,833
Sq Ft
$635/Sq Ft
Est. Value
About This Home
This home is located at 6054 Chandler Dr, San Diego, CA 92117 and is currently estimated at $1,163,195, approximately $634 per square foot. 6054 Chandler Dr is a home located in San Diego County with nearby schools including Lafayette Elementary, Innovation Middle School, and Madison High School.
Ownership History
Date
Name
Owned For
Owner Type
Purchase Details
Closed on
Apr 9, 2002
Sold by
Burger Mary R
Bought by
Burger Randall W
Current Estimated Value
Purchase Details
Closed on
Jul 13, 1995
Sold by
Ma Betty
Bought by
Burger Richard P and Burger Mary R
Home Financials for this Owner
Home Financials are based on the most recent Mortgage that was taken out on this home.
Original Mortgage
$176,130
Interest Rate
7.5%
Mortgage Type
Assumption
Purchase Details
Closed on
Apr 20, 1995
Sold by
Ma Kung Shiang
Bought by
Ma Betty
Purchase Details
Closed on
Mar 21, 1995
Sold by
Resolution Trust Corp
Bought by
Ma Betty
Purchase Details
Closed on
Jan 23, 1995
Sold by
Federal Home Loan Mortgage Corporation
Bought by
Resolution Trust Corp and Home Fed Bank F A
Purchase Details
Closed on
Jul 26, 1994
Sold by
National Home Mtg Corp
Bought by
Federal Home Loan Mortgage Corporation
Purchase Details
Closed on
Mar 21, 1989
Create a Home Valuation Report for This Property
The Home Valuation Report is an in-depth analysis detailing your home's value as well as a comparison with similar homes in the area
Home Values in the Area
Average Home Value in this Area
Purchase History
| Date | Buyer | Sale Price | Title Company |
|---|---|---|---|
| Burger Randall W | -- | -- | |
| Burger Richard P | $171,000 | Chicago Title Co | |
| Ma Betty | -- | Orange Coast Title Company | |
| Ma Betty | $149,000 | Orange Coast Title Company | |
| Resolution Trust Corp | -- | -- | |
| Federal Home Loan Mortgage Corporation | $175,000 | Westland Title | |
| -- | $219,000 | -- |
Source: Public Records
Mortgage History
| Date | Status | Borrower | Loan Amount |
|---|---|---|---|
| Closed | Burger Richard P | $176,130 |
Source: Public Records
Tax History Compared to Growth
Tax History
| Year | Tax Paid | Tax Assessment Tax Assessment Total Assessment is a certain percentage of the fair market value that is determined by local assessors to be the total taxable value of land and additions on the property. | Land | Improvement |
|---|---|---|---|---|
| 2025 | $3,369 | $284,048 | $166,113 | $117,935 |
| 2024 | $3,369 | $278,479 | $162,856 | $115,623 |
| 2023 | $3,293 | $273,019 | $159,663 | $113,356 |
| 2022 | $3,204 | $267,667 | $156,533 | $111,134 |
| 2021 | $3,180 | $262,419 | $153,464 | $108,955 |
| 2020 | $3,141 | $259,729 | $151,891 | $107,838 |
| 2019 | $3,084 | $254,637 | $148,913 | $105,724 |
| 2018 | $2,883 | $249,645 | $145,994 | $103,651 |
| 2017 | $2,812 | $244,751 | $143,132 | $101,619 |
| 2016 | $2,765 | $239,953 | $140,326 | $99,627 |
| 2015 | $2,723 | $236,350 | $138,219 | $98,131 |
| 2014 | $2,680 | $231,721 | $135,512 | $96,209 |
Source: Public Records
Map
Nearby Homes
- 5768 Camber Dr
- 5783 Camber Dr
- 5715 Castleton Dr
- 5656 Chandler Dr
- 4261 Cannington Dr
- 6602 Beadnell Way Unit 13
- 6666 Beadnell Way Unit 9
- 6666 Beadnell Way Unit 15
- 6750 Beadnell Way Unit 3
- 4410 Charger Blvd
- 5402 Balboa Arms Dr Unit 345
- 5404 Balboa Arms Dr Unit 461
- 6939 Bettyhill Dr
- 6333 Mount Ada Rd Unit 278
- 6333 Mount Ada Rd Unit 258
- 6333 Mount Ada Rd Unit 156
- 6333 Mount Ada Rd Unit 183
- 5252 Balboa Arms Dr Unit 180
- 5252 Balboa Arms Dr Unit 171
- 6535 Mount Albertine Ct
- 6034 Chandler Dr
- 6104 Chandler Dr
- 6014 Chandler Dr
- 6124 Chandler Dr
- 5958 Chandler Dr
- 6144 Chandler Dr
- 6051 Chandler Dr
- 6101 Chandler Dr
- 6031 Chandler Dr
- 6121 Chandler Dr
- 6141 Chandler Dr
- 6011 Chandler Dr
- 6164 Chandler Dr
- 5938 Chandler Dr
- 6161 Chandler Dr
- 5955 Chandler Dr
- 5976 Castleton Dr
- 5964 Castleton Dr
- 5988 Castleton Dr
- 5952 Castleton Dr