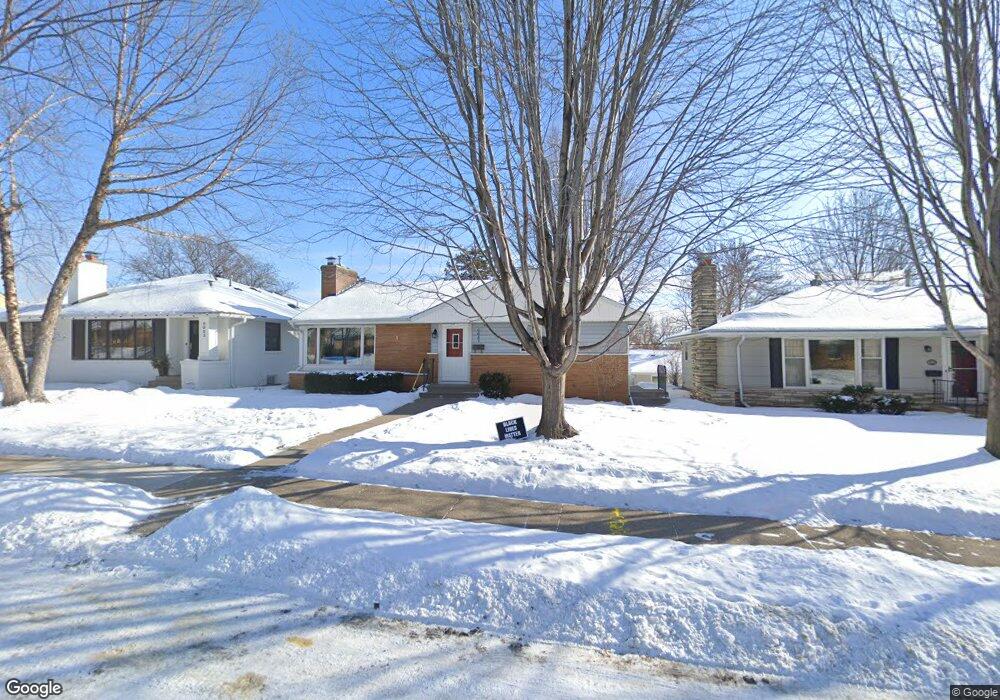
6057 Logan Ave S Minneapolis, MN 55419
Kenny NeighborhoodEstimated Value: $440,000 - $466,353
3
Beds
2
Baths
1,115
Sq Ft
$407/Sq Ft
Est. Value
About This Home
This home is located at 6057 Logan Ave S, Minneapolis, MN 55419 and is currently estimated at $454,338, approximately $407 per square foot. 6057 Logan Ave S is a home located in Hennepin County with nearby schools including Kenny Community School, Anthony Middle School, and Southwest Senior High School.
Ownership History
Date
Name
Owned For
Owner Type
Purchase Details
Closed on
May 15, 2015
Sold by
Scoll Adam D and Scoll Kristen K
Bought by
Shaftel Douglas D and Shaftel Mya J
Current Estimated Value
Home Financials for this Owner
Home Financials are based on the most recent Mortgage that was taken out on this home.
Original Mortgage
$239,900
Outstanding Balance
$184,542
Interest Rate
3.64%
Mortgage Type
New Conventional
Estimated Equity
$269,796
Purchase Details
Closed on
Jun 2, 2014
Sold by
Scoll Adam D and Scoll Kristen K
Bought by
Scoll Adam D and Scoll Kristen K
Home Financials for this Owner
Home Financials are based on the most recent Mortgage that was taken out on this home.
Original Mortgage
$281,700
Interest Rate
4.25%
Mortgage Type
Adjustable Rate Mortgage/ARM
Purchase Details
Closed on
May 26, 2006
Sold by
Knight Steven R and Knight Sherri L
Bought by
Reed Kristen K and Scoll Adam D
Create a Home Valuation Report for This Property
The Home Valuation Report is an in-depth analysis detailing your home's value as well as a comparison with similar homes in the area
Home Values in the Area
Average Home Value in this Area
Purchase History
| Date | Buyer | Sale Price | Title Company |
|---|---|---|---|
| Shaftel Douglas D | $299,900 | Titlesmart Inc | |
| Scoll Adam D | -- | Titlenexus Llc | |
| Reed Kristen K | $312,000 | -- |
Source: Public Records
Mortgage History
| Date | Status | Borrower | Loan Amount |
|---|---|---|---|
| Open | Shaftel Douglas D | $239,900 | |
| Previous Owner | Scoll Adam D | $281,700 |
Source: Public Records
Tax History Compared to Growth
Tax History
| Year | Tax Paid | Tax Assessment Tax Assessment Total Assessment is a certain percentage of the fair market value that is determined by local assessors to be the total taxable value of land and additions on the property. | Land | Improvement |
|---|---|---|---|---|
| 2024 | $6,221 | $427,000 | $176,000 | $251,000 |
| 2023 | $5,849 | $449,000 | $185,000 | $264,000 |
| 2022 | $5,764 | $473,000 | $148,000 | $325,000 |
| 2021 | $5,284 | $416,000 | $104,000 | $312,000 |
| 2020 | $5,723 | $396,000 | $101,400 | $294,600 |
| 2019 | $5,588 | $396,000 | $83,200 | $312,800 |
| 2018 | $4,916 | $377,000 | $83,200 | $293,800 |
| 2017 | $4,439 | $297,500 | $75,600 | $221,900 |
| 2016 | $3,991 | $263,000 | $75,600 | $187,400 |
| 2015 | -- | $263,000 | $75,600 | $187,400 |
| 2014 | -- | $241,000 | $70,700 | $170,300 |
Source: Public Records
Map
Nearby Homes
- 6107 Penn Ave S
- 6045 Penn Ave S
- 6129 Penn Ave S
- 6041 Penn Ave S
- 1821 W 59th St
- 6308 Newton Ave S
- 5753 Newton Ave S
- 6444 Logan Ave S
- 5801 Fremont Ave S
- 6164 Colfax Ln S
- 5825 Vincent Ave S
- 5829 Vincent Ave S
- 5535 Penn Ave S
- 1125 Woodlake Ln Unit 1
- 6709 Humboldt Ave S
- 6300 Xerxes Ave S Unit 31
- 5601 Upton Ave S
- 5749 Xerxes Ave S
- 912 W 66th St
- 6301 York Ave S Unit 102
- 6061 Logan Ave S
- 6053 Logan Ave S
- 6065 Logan Ave S
- 6049 Logan Ave S
- 6064 Knox Ave S
- 6068 Knox Ave S
- 6045 Logan Ave S
- 6058 Knox Ave S
- 6052 Logan Ave S
- 6072 Knox Ave S
- 6056 Logan Ave S
- 6048 Logan Ave S
- 6052 Knox Ave S
- 6060 Logan Ave S
- 6044 Logan Ave S
- 6101 Logan Ave S
- 6041 Logan Ave S
- 6048 Knox Ave S
- 6040 Logan Ave S
- 6100 Knox Ave S