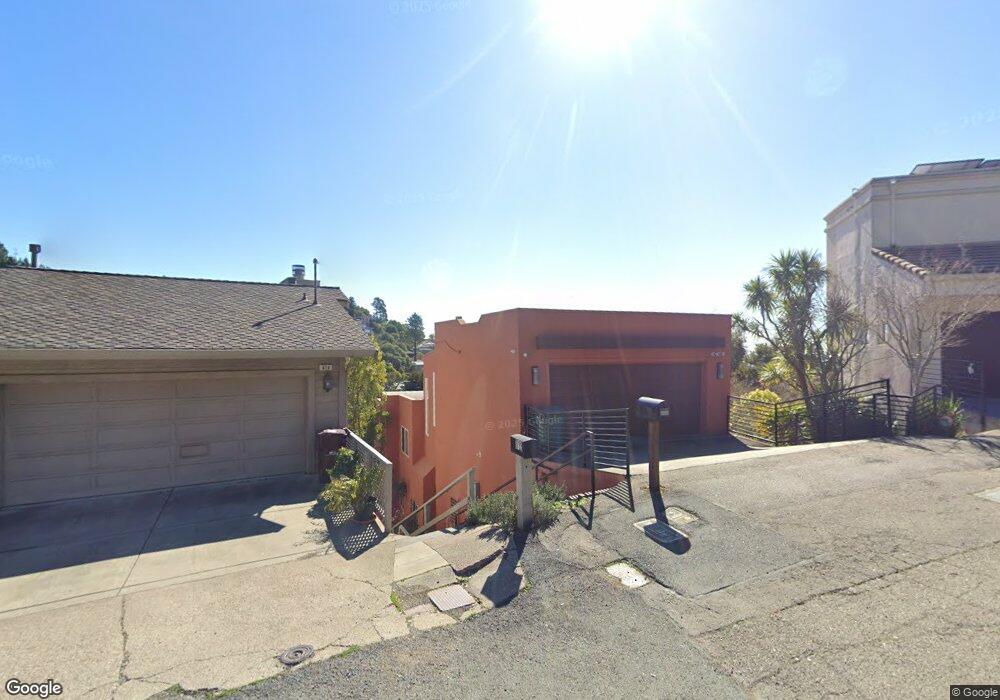
606 Gravatt Dr Berkeley, CA 94705
Claremont Hills NeighborhoodEstimated Value: $1,917,747 - $2,629,000
4
Beds
3
Baths
3,150
Sq Ft
$749/Sq Ft
Est. Value
About This Home
This home is located at 606 Gravatt Dr, Berkeley, CA 94705 and is currently estimated at $2,359,437, approximately $749 per square foot. 606 Gravatt Dr is a home located in Alameda County with nearby schools including Chabot Elementary School, Thornhill Elementary School, and Claremont Middle School.
Ownership History
Date
Name
Owned For
Owner Type
Purchase Details
Closed on
Apr 21, 2012
Sold by
Wong Tsz Keung and Wong Wavy
Bought by
Wong Tsz Keung and Wong Wavy
Current Estimated Value
Purchase Details
Closed on
Oct 20, 2004
Sold by
Rogers Michael W
Bought by
Wong Tsz Keung and Wong Wavy Sa Hui
Home Financials for this Owner
Home Financials are based on the most recent Mortgage that was taken out on this home.
Original Mortgage
$500,000
Outstanding Balance
$247,127
Interest Rate
5.74%
Mortgage Type
Purchase Money Mortgage
Estimated Equity
$2,112,310
Purchase Details
Closed on
Aug 22, 2003
Sold by
Repstad Kimberly C
Bought by
Rogers Michael W
Home Financials for this Owner
Home Financials are based on the most recent Mortgage that was taken out on this home.
Original Mortgage
$750,000
Interest Rate
4.87%
Mortgage Type
Purchase Money Mortgage
Purchase Details
Closed on
Jun 4, 2002
Sold by
Leung Kam W and Leung Kim F
Bought by
Rogers Michael W and Repstad Kimberly C
Home Financials for this Owner
Home Financials are based on the most recent Mortgage that was taken out on this home.
Original Mortgage
$750,000
Interest Rate
6.83%
Mortgage Type
Stand Alone First
Purchase Details
Closed on
May 11, 2000
Sold by
Leung Kam W and Leung Kim F
Bought by
Leung Kam W and Leung Kim F
Purchase Details
Closed on
Feb 3, 2000
Sold by
Kims Flooring Inc
Bought by
Leung Kam W and Leung Kim F
Purchase Details
Closed on
Dec 21, 1998
Sold by
Leung Kam W
Bought by
Kims Flooring Inc
Purchase Details
Closed on
May 6, 1998
Sold by
Kalmanoff Alan
Bought by
Leung Kam W
Home Financials for this Owner
Home Financials are based on the most recent Mortgage that was taken out on this home.
Original Mortgage
$235,000
Interest Rate
7.13%
Mortgage Type
Construction
Create a Home Valuation Report for This Property
The Home Valuation Report is an in-depth analysis detailing your home's value as well as a comparison with similar homes in the area
Home Values in the Area
Average Home Value in this Area
Purchase History
| Date | Buyer | Sale Price | Title Company |
|---|---|---|---|
| Wong Tsz Keung | -- | None Available | |
| Wong Tsz Keung | $1,300,000 | California Title Company Of | |
| Rogers Michael W | -- | Fidelity National Title Co | |
| Rogers Michael W | $960,000 | Chicago Title Co | |
| Leung Kam W | -- | -- | |
| Leung Kam W | -- | -- | |
| Leung Kam W | $106,000 | Commonwealth Land Title Co | |
| Kims Flooring Inc | -- | -- | |
| Leung Kam W | $106,000 | North American Title Co |
Source: Public Records
Mortgage History
| Date | Status | Borrower | Loan Amount |
|---|---|---|---|
| Open | Wong Tsz Keung | $500,000 | |
| Previous Owner | Rogers Michael W | $750,000 | |
| Previous Owner | Rogers Michael W | $750,000 | |
| Previous Owner | Leung Kam W | $235,000 | |
| Closed | Wong Tsz Keung | $340,000 |
Source: Public Records
Tax History
| Year | Tax Paid | Tax Assessment Tax Assessment Total Assessment is a certain percentage of the fair market value that is determined by local assessors to be the total taxable value of land and additions on the property. | Land | Improvement |
|---|---|---|---|---|
| 2025 | $24,526 | $1,804,914 | $627,201 | $1,184,713 |
| 2024 | $24,526 | $1,769,398 | $614,907 | $1,161,491 |
| 2023 | $25,947 | $1,741,570 | $602,851 | $1,138,719 |
| 2022 | $25,508 | $1,700,432 | $591,034 | $1,116,398 |
| 2021 | $24,824 | $1,666,958 | $579,447 | $1,094,511 |
| 2020 | $24,550 | $1,656,798 | $573,507 | $1,083,291 |
| 2019 | $23,845 | $1,624,324 | $562,266 | $1,062,058 |
| 2018 | $23,342 | $1,592,486 | $551,245 | $1,041,241 |
| 2017 | $22,525 | $1,561,274 | $540,441 | $1,020,833 |
| 2016 | $21,991 | $1,530,672 | $529,848 | $1,000,824 |
| 2015 | $21,876 | $1,507,688 | $521,892 | $985,796 |
| 2014 | $22,178 | $1,478,164 | $511,672 | $966,492 |
Source: Public Records
Map
Nearby Homes
- 1102 Grand View Dr
- 0 Dartmouth Dr
- 29 Live Oak Rd
- 1215 Alvarado Rd
- 1426 Grand View Dr
- 7041 Devon Way
- 150 Vicente Rd
- 142 Gravatt Dr
- 1375 Alvarado Rd
- 1383 Alvarado Rd
- 0 Gypsy Ln
- 260 Alvarado Rd
- 7723 Claremont Ave
- 1881 Grand View Dr
- 0 Buckingham Blvd Unit 41115384
- 7003 Buckingham Blvd
- 7084 Westmoorland Dr
- 6971 Bristol Dr
- 0 Gravatt Dr Unit 41122154
- 2 Gravatt Dr
- 616 Gravatt Dr
- 600 Gravatt Dr
- 620 Gravatt Dr
- 1110 Grand View Dr
- 1102 W Grandview Dr
- 630 Gravatt Dr
- 1138 Grand View Dr
- 2 Perth Place
- 0 Perth Place
- 1210 Grand View Dr
- 0 View Dr Unit 40468391
- 590 Gravatt Dr
- 1150 Westview Dr
- 1228 Grand View Dr
- 1240 Grand View Dr
- 1150 Besito Ave
- 638 Gravatt Dr
- 1 Westview Place
- 8 Perth Place
- 1100 Westview Dr
Your Personal Tour Guide
Ask me questions while you tour the home.