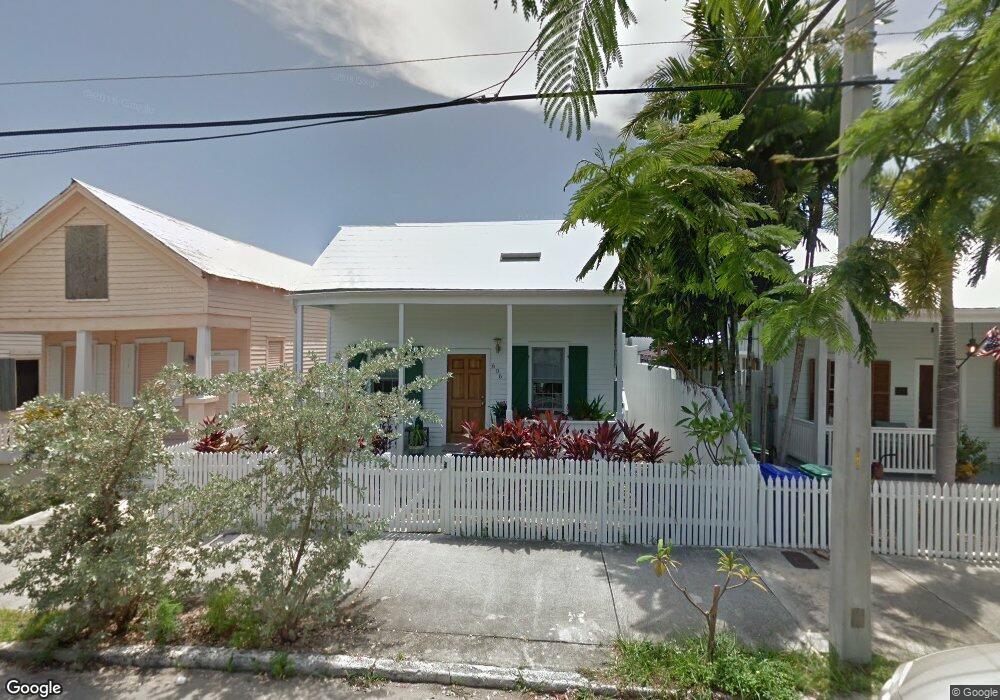
606 Grinnell St Unit 1 &2 Key West, FL 33040
Old Town NeighborhoodEstimated Value: $1,655,000 - $1,826,000
5
Beds
3
Baths
2,628
Sq Ft
$668/Sq Ft
Est. Value
About This Home
This home is located at 606 Grinnell St Unit 1 &2, Key West, FL 33040 and is currently estimated at $1,756,333, approximately $668 per square foot. 606 Grinnell St Unit 1 &2 is a home located in Monroe County with nearby schools including Horace O'Bryant School, Key West High School, and May Sands Montessori School.
Ownership History
Date
Name
Owned For
Owner Type
Purchase Details
Closed on
Feb 19, 2019
Sold by
James Olinkiewicz
Bought by
King Kathy
Current Estimated Value
Purchase Details
Closed on
Feb 15, 2019
Sold by
James Olinkiewicz
Bought by
King Kathy
Purchase Details
Closed on
Nov 17, 2016
Sold by
Guariniello Traci Dill
Bought by
Olinkiewicz James
Purchase Details
Closed on
Jul 20, 2007
Sold by
Guariniello Traci Dill and Guariniello Modestino
Bought by
Guariniello Traci Dill
Purchase Details
Closed on
Aug 1, 2006
Sold by
Dill Charles H
Bought by
Guariniello Traci Dill and Dill David C
Purchase Details
Closed on
Dec 1, 1984
Bought by
Guariniello Traci Dill
Purchase Details
Closed on
Feb 1, 1975
Bought by
Guariniello Traci Dill
Purchase Details
Closed on
Jan 1, 1901
Sold by
Dill David M
Bought by
Dill Charles H
Create a Home Valuation Report for This Property
The Home Valuation Report is an in-depth analysis detailing your home's value as well as a comparison with similar homes in the area
Home Values in the Area
Average Home Value in this Area
Purchase History
| Date | Buyer | Sale Price | Title Company |
|---|---|---|---|
| King Kathy | $100 | None Listed On Document | |
| King Kathy | $100 | None Listed On Document | |
| Olinkiewicz James | $1,000,000 | Attorney | |
| Guariniello Traci Dill | -- | Attorney | |
| Guariniello Traci Dill | -- | Philip R Seaver Title Co Inc | |
| Guariniello Traci Dill | $45,000 | -- | |
| Guariniello Traci Dill | $30,000 | -- | |
| Dill Charles H | $45,000 | -- |
Source: Public Records
Tax History Compared to Growth
Tax History
| Year | Tax Paid | Tax Assessment Tax Assessment Total Assessment is a certain percentage of the fair market value that is determined by local assessors to be the total taxable value of land and additions on the property. | Land | Improvement |
|---|---|---|---|---|
| 2024 | $11,401 | $1,521,242 | -- | -- |
| 2023 | $11,401 | $1,455,634 | $840,257 | $615,377 |
| 2022 | $9,142 | $1,135,752 | $636,355 | $499,397 |
| 2021 | $8,450 | $916,110 | $482,494 | $433,616 |
| 2020 | $7,978 | $865,205 | $442,162 | $423,043 |
| 2019 | $8,038 | $864,396 | $431,705 | $432,691 |
| 2018 | $8,043 | $847,154 | $404,817 | $442,337 |
| 2017 | $8,227 | $852,150 | $0 | $0 |
| 2016 | $7,872 | $1,046,033 | $0 | $0 |
| 2015 | $6,126 | $598,984 | $0 | $0 |
| 2014 | $5,701 | $511,508 | $0 | $0 |
Source: Public Records
Map
Nearby Homes
- 610 Griffin Ln
- 918 Southard St Unit 105
- 609 1/2 Margaret St
- 626 Margaret St
- 1014 Southard St
- 1020 Southard St
- 508 Grinnell St
- 1017 Angela St
- 806 Southard St
- 1008 Fleming St
- 1020 Fleming St Unit Street
- 1022 Fleming St
- 709 Frances St
- 1109 Stump Ln
- 522 William St
- 628 William St
- 1113 Stump Ln
- 729 Windsor Ln
- 620 White St
- 711 Galveston Ln
- 606 Grinnell St
- 604 Grinnell St
- 608 Grinnell St
- 926 Southard St
- 610 Grinnell St
- 924 Southard St
- 614 Grinnell St
- 1000 Southard St
- 608 Griffin Ln
- 919 Southard St
- 919 Southard St
- 607 Grinnell St Unit 77
- 1004 Southard St
- 918 Southard St
- 918 Southard St Unit 101
- 918 Southard St Unit 110
- 918 Southard St Unit 111
- 918 Southard St Unit 201
- 918 Southard St Unit 205
- 918 Southard St Unit 203