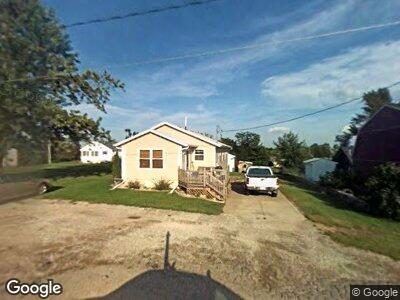
606 N Main St New Sharon, IA 50207
Estimated Value: $142,000 - $160,000
3
Beds
1
Bath
1,062
Sq Ft
$141/Sq Ft
Est. Value
About This Home
This home is located at 606 N Main St, New Sharon, IA 50207 and is currently estimated at $149,991, approximately $141 per square foot. 606 N Main St is a home located in Mahaska County with nearby schools including North Mahaska Elementary School and North Mahaska Junior/Senior High School.
Ownership History
Date
Name
Owned For
Owner Type
Purchase Details
Closed on
Nov 3, 2021
Sold by
Livezey Sandi K
Bought by
Livezey William H
Current Estimated Value
Home Financials for this Owner
Home Financials are based on the most recent Mortgage that was taken out on this home.
Original Mortgage
$100,000
Outstanding Balance
$93,722
Interest Rate
2.99%
Mortgage Type
FHA
Purchase Details
Closed on
Dec 21, 2020
Sold by
William H And Marjorie C Schimmel Trust
Bought by
Kljk Corporation
Create a Home Valuation Report for This Property
The Home Valuation Report is an in-depth analysis detailing your home's value as well as a comparison with similar homes in the area
Home Values in the Area
Average Home Value in this Area
Purchase History
| Date | Buyer | Sale Price | Title Company |
|---|---|---|---|
| Livezey William H | -- | -- | |
| Kljk Corporation | $414,000 | None Listed On Document |
Source: Public Records
Mortgage History
| Date | Status | Borrower | Loan Amount |
|---|---|---|---|
| Open | Livezey William H | $100,000 | |
| Previous Owner | Livezey William H | $40,000 |
Source: Public Records
Tax History Compared to Growth
Tax History
| Year | Tax Paid | Tax Assessment Tax Assessment Total Assessment is a certain percentage of the fair market value that is determined by local assessors to be the total taxable value of land and additions on the property. | Land | Improvement |
|---|---|---|---|---|
| 2024 | $1,718 | $122,780 | $15,240 | $107,540 |
| 2023 | $1,718 | $122,780 | $15,240 | $107,540 |
| 2022 | $1,554 | $91,860 | $15,240 | $76,620 |
| 2021 | $1,382 | $91,860 | $15,240 | $76,620 |
| 2020 | $1,382 | $81,670 | $10,890 | $70,780 |
| 2019 | $1,254 | $77,290 | $0 | $0 |
| 2018 | $1,254 | $77,290 | $0 | $0 |
| 2017 | $1,214 | $72,920 | $0 | $0 |
| 2016 | $1,082 | $72,920 | $0 | $0 |
| 2015 | $1,082 | $72,920 | $0 | $0 |
| 2014 | $968 | $72,920 | $0 | $0 |
Source: Public Records
Map
Nearby Homes