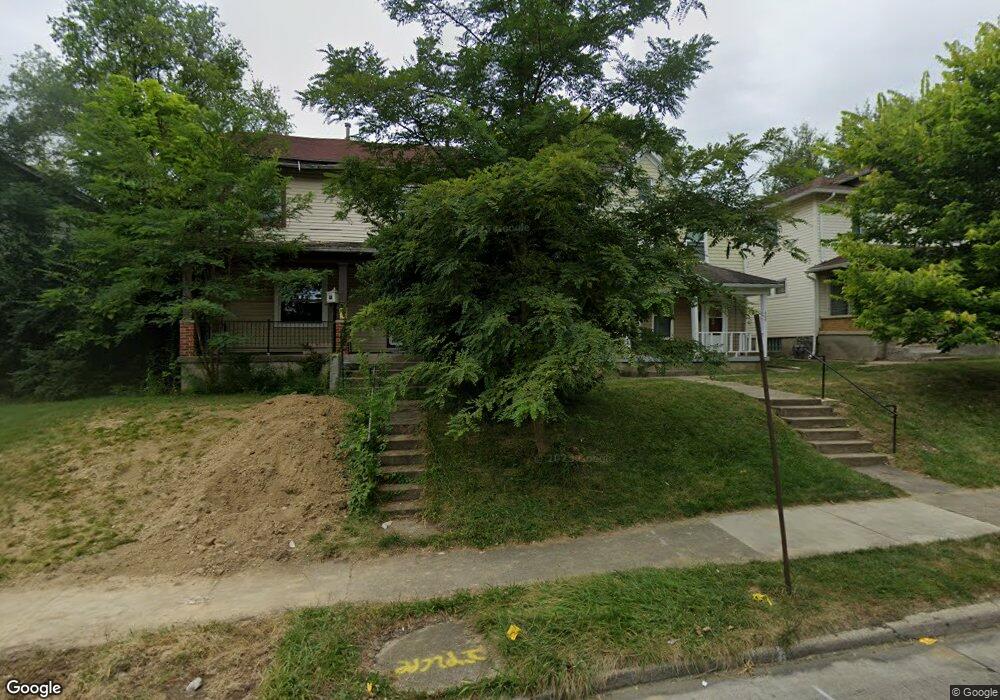
606 W Fairview Ave Dayton, OH 45405
Fairview NeighborhoodEstimated Value: $81,000 - $130,959
6
Beds
2
Baths
2,032
Sq Ft
$55/Sq Ft
Est. Value
About This Home
This home is located at 606 W Fairview Ave, Dayton, OH 45405 and is currently estimated at $110,990, approximately $54 per square foot. 606 W Fairview Ave is a home located in Montgomery County with nearby schools including Valerie Elementary School, Deca Prep, and Horizon Science Academy-Dayton Elementary School.
Ownership History
Date
Name
Owned For
Owner Type
Purchase Details
Closed on
Dec 2, 2022
Sold by
Real Estate For All Llc
Bought by
Good Samaritan Homes Inc
Current Estimated Value
Purchase Details
Closed on
Jul 27, 2017
Sold by
Deutsche Bank National Trust Co
Bought by
Real Estate For All Llc
Purchase Details
Closed on
Apr 10, 2017
Sold by
Mckever Lawrence D
Bought by
Deutsche Bank National Trust Co and Cdc Mortgage Capital Trust 2003 He4
Purchase Details
Closed on
Aug 19, 2003
Sold by
Laforest Larry
Bought by
Mckever Lawrence D
Home Financials for this Owner
Home Financials are based on the most recent Mortgage that was taken out on this home.
Original Mortgage
$45,000
Interest Rate
8.5%
Mortgage Type
Purchase Money Mortgage
Purchase Details
Closed on
Jun 23, 1998
Sold by
Marcille Coppock Don C and Coppock Marcille
Bought by
Coppock Don C and Marcille Coppock V
Create a Home Valuation Report for This Property
The Home Valuation Report is an in-depth analysis detailing your home's value as well as a comparison with similar homes in the area
Home Values in the Area
Average Home Value in this Area
Purchase History
| Date | Buyer | Sale Price | Title Company |
|---|---|---|---|
| Good Samaritan Homes Inc | $59,900 | Vantage Land Title | |
| Real Estate For All Llc | $14,000 | Premium Title Services Inc | |
| Deutsche Bank National Trust Co | $22,000 | None Available | |
| Mckever Lawrence D | $50,000 | Titlequest Agency Inc | |
| Coppock Don C | -- | -- | |
| Coppock Don C | -- | -- |
Source: Public Records
Mortgage History
| Date | Status | Borrower | Loan Amount |
|---|---|---|---|
| Previous Owner | Mckever Lawrence D | $45,000 |
Source: Public Records
Tax History Compared to Growth
Tax History
| Year | Tax Paid | Tax Assessment Tax Assessment Total Assessment is a certain percentage of the fair market value that is determined by local assessors to be the total taxable value of land and additions on the property. | Land | Improvement |
|---|---|---|---|---|
| 2024 | $1,175 | $19,830 | $3,650 | $16,180 |
| 2023 | $1,175 | $19,830 | $3,650 | $16,180 |
| 2022 | $1,213 | $15,860 | $2,920 | $12,940 |
| 2021 | $2,083 | $15,860 | $2,920 | $12,940 |
| 2020 | $1,205 | $15,860 | $2,920 | $12,940 |
| 2019 | $1,256 | $14,490 | $2,920 | $11,570 |
| 2018 | $1,285 | $14,490 | $2,920 | $11,570 |
| 2017 | $1,283 | $14,490 | $2,920 | $11,570 |
| 2016 | $1,633 | $15,910 | $2,920 | $12,990 |
| 2015 | $1,316 | $15,910 | $2,920 | $12,990 |
| 2014 | $1,316 | $15,910 | $2,920 | $12,990 |
| 2012 | -- | $13,170 | $3,640 | $9,530 |
Source: Public Records
Map
Nearby Homes
- 513 W Fairview Ave
- 2302 Rustic Rd
- 2218 Rugby Rd
- 522 Cherry Dr
- 2206 Catalpa Dr Unit 2204
- 2218 Catalpa Dr
- 17 Marie Ave
- 421 W Hudson Ave
- 2235 Catalpa Dr Unit 2233
- 469 Allwen Dr
- 2136 Ravenwood Ave
- 349 Cherry Dr
- 1907 Emerson Ave
- 2068 Ravenwood Ave
- 245 Valleyview Dr
- 2062 Ravenwood Ave Unit 2060
- 2052 Ravenwood Ave
- 1008 W Fairview Ave
- 2047 Ravenwood Ave
- 2031 Ravenwood Ave
- 602 W Fairview Ave
- 610 W Fairview Ave
- 614 W Fairview Ave
- 600 W Fairview Ave
- 618 W Fairview Ave
- 2069 Rustic Rd
- 622 W Fairview Ave
- 2110 Emerson Ave
- 2100 Emerson Ave
- 626 W Fairview Ave
- 2065 Rustic Rd
- 540 W Fairview Ave
- 2068 Emerson Ave
- 536 W Fairview Ave
- 2062 Emerson Ave
- 2059 Rustic Rd
- 630 W Fairview Ave
- 2106 Rustic Rd
- 2058 Emerson Ave
- 625 W Fairview Ave