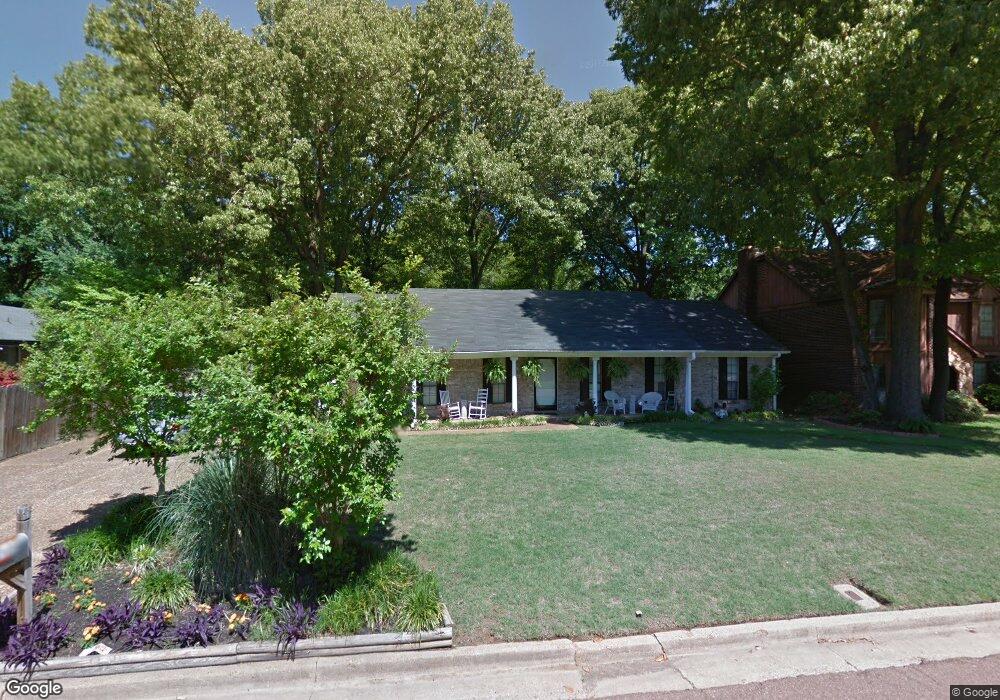
6062 Explorer Rd Memphis, TN 38134
Estimated Value: $271,606 - $298,000
4
Beds
2
Baths
2,194
Sq Ft
$131/Sq Ft
Est. Value
About This Home
This home is located at 6062 Explorer Rd, Memphis, TN 38134 and is currently estimated at $287,902, approximately $131 per square foot. 6062 Explorer Rd is a home located in Shelby County with nearby schools including Altruria Elementary School, Elmore Park Middle School, and Bartlett High School.
Ownership History
Date
Name
Owned For
Owner Type
Purchase Details
Closed on
Nov 30, 2016
Sold by
Gibson Stephen
Bought by
Soldone Bonnie L and Kibson Bonnie L
Current Estimated Value
Purchase Details
Closed on
Nov 16, 2005
Sold by
Miller Ewell D and Guenther Hans
Bought by
Gibson Stephen
Home Financials for this Owner
Home Financials are based on the most recent Mortgage that was taken out on this home.
Original Mortgage
$119,920
Outstanding Balance
$70,639
Interest Rate
7.5%
Mortgage Type
Fannie Mae Freddie Mac
Estimated Equity
$217,263
Purchase Details
Closed on
Jan 16, 2001
Sold by
Holmon Garland R
Bought by
Gaston Norman and Gaston Casondra Tate
Home Financials for this Owner
Home Financials are based on the most recent Mortgage that was taken out on this home.
Original Mortgage
$102,000
Interest Rate
13.62%
Purchase Details
Closed on
Nov 16, 1998
Sold by
Petty Nelson Dwayne and Petty Susan A
Bought by
Hud
Create a Home Valuation Report for This Property
The Home Valuation Report is an in-depth analysis detailing your home's value as well as a comparison with similar homes in the area
Home Values in the Area
Average Home Value in this Area
Purchase History
| Date | Buyer | Sale Price | Title Company |
|---|---|---|---|
| Soldone Bonnie L | -- | None Available | |
| Gibson Stephen | $149,900 | -- | |
| Gaston Norman | $136,000 | Equity Title & Escrow Co | |
| Miller Ewell D | $99,001 | -- | |
| Gaston Norman | $136,000 | Equity Title & Escrow Co | |
| Hud | $127,727 | -- | |
| Hud | $127,727 | -- |
Source: Public Records
Mortgage History
| Date | Status | Borrower | Loan Amount |
|---|---|---|---|
| Open | Gibson Stephen | $119,920 | |
| Previous Owner | Gaston Norman | $102,000 | |
| Closed | Gaston Norman | $27,200 | |
| Closed | Gibson Stephen | $29,980 |
Source: Public Records
Tax History
| Year | Tax Paid | Tax Assessment Tax Assessment Total Assessment is a certain percentage of the fair market value that is determined by local assessors to be the total taxable value of land and additions on the property. | Land | Improvement |
|---|---|---|---|---|
| 2025 | $2,657 | $69,150 | $14,750 | $54,400 |
| 2024 | $2,657 | $51,900 | $10,125 | $41,775 |
| 2023 | $2,657 | $51,900 | $10,125 | $41,775 |
| 2022 | $2,657 | $51,900 | $10,125 | $41,775 |
| 2021 | $2,699 | $51,900 | $10,125 | $41,775 |
| 2020 | $2,311 | $39,300 | $8,225 | $31,075 |
| 2019 | $2,311 | $39,300 | $8,225 | $31,075 |
| 2018 | $2,311 | $39,300 | $8,225 | $31,075 |
| 2017 | $1,615 | $39,300 | $8,225 | $31,075 |
| 2016 | $1,417 | $32,425 | $0 | $0 |
| 2014 | $1,417 | $32,425 | $0 | $0 |
Source: Public Records
Map
Nearby Homes
- 6069 Blue Springs Ave
- 6189 Ivanhoe Rd
- 2623 Surrey Wood Dr
- 2662 Elmore Park Rd
- 2534 Elmore Park Rd
- 2744 Surrey Park Dr
- 2426 Lacosta Dr
- 2745 Satellite St
- 2784 Bragg Ln
- 2534 Bartlett Blvd
- 2798 Stage Center Dr
- 2780 Elmore Park Rd
- 2723 Mercury St
- 0 Stage Center Cove
- 5994 Elmore Rd
- 2823 Elmore Park Rd
- 2417 Fairway Oaks Dr
- 0 Bartlett Blvd Unit 10203764
- 0 Bartlett Blvd Unit 10203763
- 5259 Stage Rd
- 6062 Explorer Ave
- 6070 Explorer Rd
- 2590 Kenwood Ln
- 2590 Kenwood Rd
- 2600 Kenwood Rd
- 6078 Explorer Rd
- 6065 Explorer Rd
- 6057 Explorer Rd
- 6065 Explorer Ave
- 6057 Explorer Ave
- 6095 Ivawood Dr
- 6073 Explorer Rd
- 6097 Ivawood Dr
- 2574 Kenwood Ln
- 2574 Kenwood Rd
- 2610 Kenwood Rd
- 6086 Explorer Rd
- 6081 Explorer Rd
- 6081 Explorer Ave
- 6093 Ivawood Dr
Your Personal Tour Guide
Ask me questions while you tour the home.