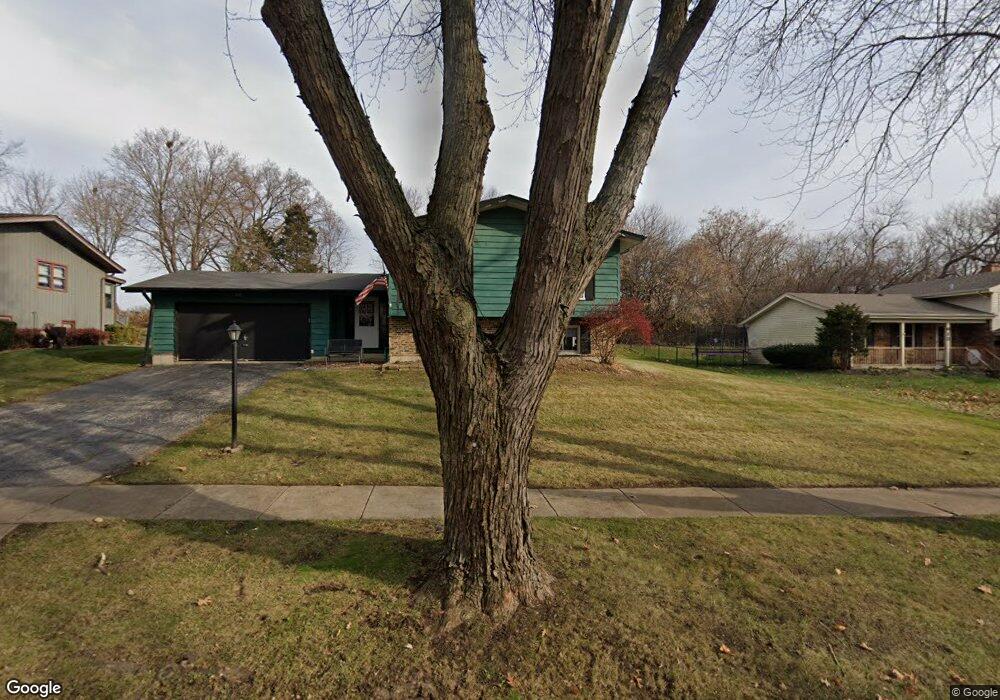
607 Scott St Algonquin, IL 60102
Estimated Value: $328,979 - $392,000
4
Beds
2
Baths
1,280
Sq Ft
$287/Sq Ft
Est. Value
About This Home
This home is located at 607 Scott St, Algonquin, IL 60102 and is currently estimated at $366,745, approximately $286 per square foot. 607 Scott St is a home located in McHenry County with nearby schools including Eastview Elementary School, Algonquin Middle School, and Dundee-Crown High School.
Ownership History
Date
Name
Owned For
Owner Type
Purchase Details
Closed on
Nov 13, 1998
Sold by
Salt Howard T and Salt Joanne E
Bought by
Lange Timothy and Lange Kathleen
Current Estimated Value
Home Financials for this Owner
Home Financials are based on the most recent Mortgage that was taken out on this home.
Original Mortgage
$164,800
Outstanding Balance
$35,540
Interest Rate
7.01%
Mortgage Type
VA
Estimated Equity
$331,205
Purchase Details
Closed on
Sep 29, 1993
Sold by
Nee John K and Nee Kathleen S
Bought by
Salt Howard T and Salt Joanne E
Home Financials for this Owner
Home Financials are based on the most recent Mortgage that was taken out on this home.
Original Mortgage
$133,000
Interest Rate
7.15%
Create a Home Valuation Report for This Property
The Home Valuation Report is an in-depth analysis detailing your home's value as well as a comparison with similar homes in the area
Purchase History
| Date | Buyer | Sale Price | Title Company |
|---|---|---|---|
| Lange Timothy | $160,000 | -- | |
| Salt Howard T | $153,000 | -- |
Source: Public Records
Mortgage History
| Date | Status | Borrower | Loan Amount |
|---|---|---|---|
| Open | Lange Timothy | $164,800 | |
| Previous Owner | Salt Howard T | $133,000 |
Source: Public Records
Tax History
| Year | Tax Paid | Tax Assessment Tax Assessment Total Assessment is a certain percentage of the fair market value that is determined by local assessors to be the total taxable value of land and additions on the property. | Land | Improvement |
|---|---|---|---|---|
| 2024 | $6,518 | $99,319 | $13,068 | $86,251 |
| 2023 | $6,097 | $88,829 | $11,688 | $77,141 |
| 2022 | $6,072 | $81,803 | $16,092 | $65,711 |
| 2021 | $5,786 | $76,210 | $14,992 | $61,218 |
| 2020 | $6,062 | $73,512 | $14,461 | $59,051 |
| 2019 | $5,910 | $70,360 | $13,841 | $56,519 |
| 2018 | $5,623 | $64,998 | $12,786 | $52,212 |
| 2017 | $5,500 | $61,232 | $12,045 | $49,187 |
| 2016 | $5,408 | $57,430 | $11,297 | $46,133 |
| 2013 | -- | $59,391 | $10,539 | $48,852 |
Source: Public Records
Map
Nearby Homes
- 719 Webster St
- 0 Natoma Trail
- lot 25 Wabican Trail
- 600 E Algonquin Rd
- 21 Division St
- 407 La Fox River Dr
- 0 River Dr N Unit MRD12473279
- Lot #3-5 Hayes Rd
- 1188 E Algonquin Rd
- 1420 Greenridge Ave
- 1200 Hillside View
- 953 Old Oak Cir
- Lot 4 b Ryan Pkwy
- 1770 E Algonquin Rd
- 1031 Timberwood Ln
- 308 Rustic Ln
- 615 Harper Dr
- 1923 Ozark Pkwy
- 1906 Ozark Pkwy
- 1782 Cumberland Pkwy
Your Personal Tour Guide
Ask me questions while you tour the home.