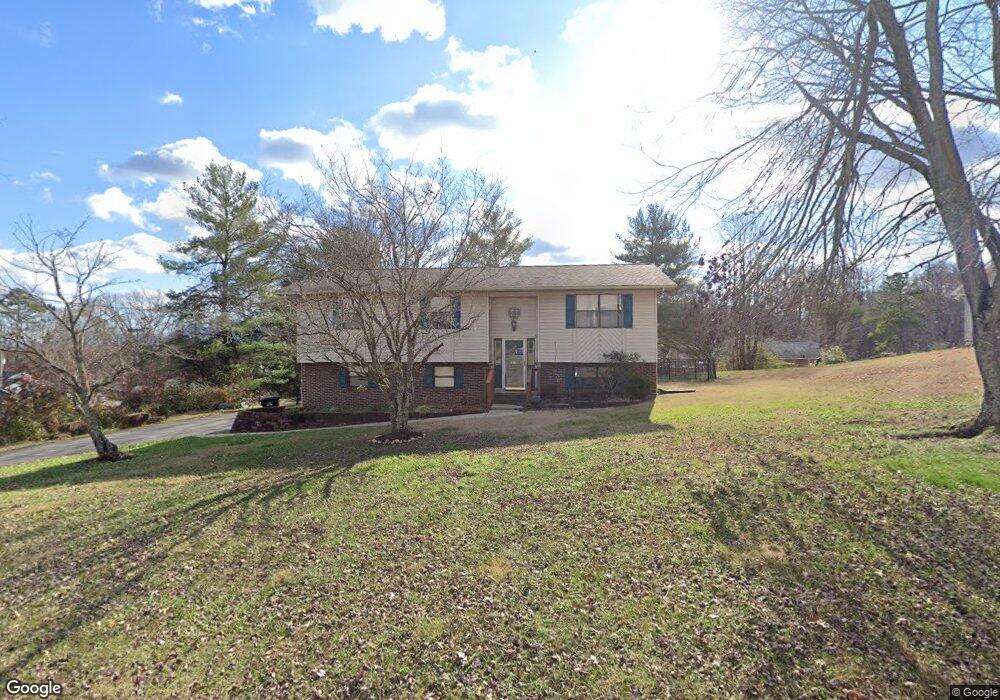
607 Valley View St Seymour, TN 37865
Estimated Value: $354,090 - $365,000
3
Beds
2
Baths
1,907
Sq Ft
$189/Sq Ft
Est. Value
About This Home
This home is located at 607 Valley View St, Seymour, TN 37865 and is currently estimated at $359,545, approximately $188 per square foot. 607 Valley View St is a home located in Sevier County with nearby schools including Northview Elementary School, Catons Chapel Elementary School, and Jones Cove Elementary School.
Ownership History
Date
Name
Owned For
Owner Type
Purchase Details
Closed on
Mar 3, 2023
Sold by
Crawford Kenneth and Crawford Karen M
Bought by
Crawford Kenneth M and Crawford Justin Wayne
Current Estimated Value
Purchase Details
Closed on
Jul 28, 2009
Sold by
Tiller Edward R
Bought by
Crawford Kenneth
Home Financials for this Owner
Home Financials are based on the most recent Mortgage that was taken out on this home.
Original Mortgage
$149,900
Interest Rate
5.26%
Purchase Details
Closed on
Aug 1, 2002
Sold by
Green Michael L and Green Freda D
Bought by
Tiller Edward R
Home Financials for this Owner
Home Financials are based on the most recent Mortgage that was taken out on this home.
Original Mortgage
$113,667
Interest Rate
6.52%
Purchase Details
Closed on
May 11, 2000
Sold by
Stoffle Larry Z
Bought by
Green Michael L
Create a Home Valuation Report for This Property
The Home Valuation Report is an in-depth analysis detailing your home's value as well as a comparison with similar homes in the area
Home Values in the Area
Average Home Value in this Area
Purchase History
| Date | Buyer | Sale Price | Title Company |
|---|---|---|---|
| Crawford Kenneth M | -- | Hometown Title | |
| Crawford Kenneth | $149,900 | -- | |
| Tiller Edward R | $114,900 | -- | |
| Green Michael L | $99,900 | -- |
Source: Public Records
Mortgage History
| Date | Status | Borrower | Loan Amount |
|---|---|---|---|
| Previous Owner | Green Michael L | $149,900 | |
| Previous Owner | Green Michael L | $113,667 |
Source: Public Records
Tax History Compared to Growth
Tax History
| Year | Tax Paid | Tax Assessment Tax Assessment Total Assessment is a certain percentage of the fair market value that is determined by local assessors to be the total taxable value of land and additions on the property. | Land | Improvement |
|---|---|---|---|---|
| 2025 | $615 | $41,550 | $7,500 | $34,050 |
| 2024 | $615 | $41,550 | $7,500 | $34,050 |
| 2023 | $615 | $41,550 | $0 | $0 |
| 2022 | $615 | $41,550 | $7,500 | $34,050 |
| 2021 | $615 | $41,550 | $7,500 | $34,050 |
| 2020 | $622 | $41,550 | $7,500 | $34,050 |
| 2019 | $622 | $33,425 | $8,850 | $24,575 |
| 2018 | $622 | $33,425 | $8,850 | $24,575 |
| 2017 | $622 | $33,425 | $8,850 | $24,575 |
| 2016 | $622 | $33,425 | $8,850 | $24,575 |
| 2015 | -- | $34,300 | $0 | $0 |
| 2014 | $559 | $34,297 | $0 | $0 |
Source: Public Records
Map
Nearby Homes
- 536 Keck St
- 521 Devon St
- 516 Keck St
- 534 Tennessee Cir
- 0 Burns Ln
- 116 Blue Ridge Ln
- 401 Burns Ln
- 205 Blue Ridge Ln
- 5925 Sevierville Rd
- 237 Westmoreland Ct
- 830 Easey St
- 372 Overlook Dr
- 648 Emerald Ave
- 325 Blue Ridge Ln
- 634 Crestview Ct
- 755 Whippoorwill Cir
- 217 Bar Tall Way
- 123 Colonial Cir
- 203 Bar Tall Way
- 309 Franklin Meadows Way
- 603 Valley View St
- 611 Valley View St
- 624 Miller Cir
- 620 Miller Cir
- 628 Miller Cir
- 606 Valley View St
- 619 Valley View St
- 616 Valley View St
- 602 Valley View St
- 632 Miller Cir
- 563 Valley View St
- 609 Miller Cir
- 622 Valley View St
- 625 Valley View St
- 607 Devon St
- 564 Valley View St
- 617 Devon St
- 646 Miller Cir
- 613 Miller Cir
- 603 Devon St