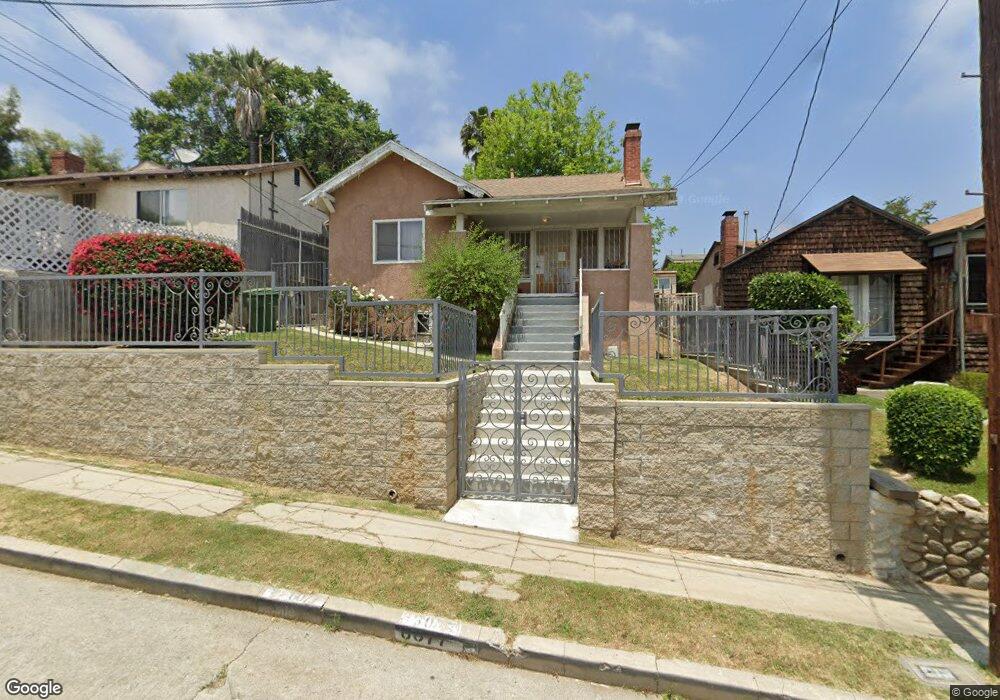
6077 Ruby Place Los Angeles, CA 90042
Highland Park NeighborhoodEstimated Value: $731,369 - $893,000
2
Beds
1
Bath
870
Sq Ft
$927/Sq Ft
Est. Value
About This Home
This home is located at 6077 Ruby Place, Los Angeles, CA 90042 and is currently estimated at $806,842, approximately $927 per square foot. 6077 Ruby Place is a home located in Los Angeles County with nearby schools including Yorkdale Elementary, Garvanza Elementary, and Franklin Middle School & High School.
Ownership History
Date
Name
Owned For
Owner Type
Purchase Details
Closed on
Sep 14, 2018
Sold by
Candia Patricia
Bought by
Candia Patricia and The Patricia Cadia Living Trus
Current Estimated Value
Purchase Details
Closed on
Nov 21, 2012
Sold by
Candia Patricia and Padua Jewell
Bought by
Candia Patricia
Home Financials for this Owner
Home Financials are based on the most recent Mortgage that was taken out on this home.
Original Mortgage
$135,885
Interest Rate
3.31%
Mortgage Type
New Conventional
Purchase Details
Closed on
May 14, 2007
Sold by
Padua Patricia Candia
Bought by
Candia Patricia
Home Financials for this Owner
Home Financials are based on the most recent Mortgage that was taken out on this home.
Original Mortgage
$100,000
Interest Rate
6.18%
Mortgage Type
New Conventional
Purchase Details
Closed on
Dec 11, 2003
Sold by
Candia Andres G
Bought by
Candia Andres G
Create a Home Valuation Report for This Property
The Home Valuation Report is an in-depth analysis detailing your home's value as well as a comparison with similar homes in the area
Home Values in the Area
Average Home Value in this Area
Purchase History
| Date | Buyer | Sale Price | Title Company |
|---|---|---|---|
| Candia Patricia | -- | None Available | |
| Candia Patricia | -- | First American Title Ins Co | |
| Candia Patricia | -- | First American Title Co | |
| Candia Andres G | -- | -- |
Source: Public Records
Mortgage History
| Date | Status | Borrower | Loan Amount |
|---|---|---|---|
| Closed | Candia Patricia | $135,885 | |
| Closed | Candia Patricia | $100,000 |
Source: Public Records
Tax History
| Year | Tax Paid | Tax Assessment Tax Assessment Total Assessment is a certain percentage of the fair market value that is determined by local assessors to be the total taxable value of land and additions on the property. | Land | Improvement |
|---|---|---|---|---|
| 2025 | $649 | $38,386 | $22,558 | $15,828 |
| 2024 | $642 | $37,634 | $22,116 | $15,518 |
| 2023 | $633 | $36,897 | $21,683 | $15,214 |
| 2022 | $607 | $36,174 | $21,258 | $14,916 |
| 2021 | $595 | $35,466 | $20,842 | $14,624 |
| 2019 | $580 | $34,417 | $20,225 | $14,192 |
| 2018 | $524 | $33,743 | $19,829 | $13,914 |
| 2016 | $490 | $32,435 | $19,060 | $13,375 |
| 2015 | $484 | $31,949 | $18,774 | $13,175 |
| 2014 | $495 | $31,324 | $18,407 | $12,917 |
Source: Public Records
Map
Nearby Homes
- 355 Newland St
- 252 Branch St
- 248 Branch St
- 6225 Beard St
- 411 Kirby St
- 6201 1/2 Saylin Ln
- 6072 York Blvd
- 6072 Delphi St
- 329 Marie Ave
- 6225 Saylin Ln
- 0 N Avenue 62
- 6178 Aldama St
- 6017 La Prada St
- 1083 Milwaukee Ave
- 6318 Planada Ave
- 859 Cresthaven Dr
- 6203 Hillandale Dr
- 6849 N Figueroa St
- 6050 Burwood Ave
- 6154 Mount Angelus Dr
- 6073 Ruby Place
- 6081 Ruby Place
- 6069 Ruby Place
- 6101 Ruby Place
- 6078 Myosotis St
- 6105 Ruby Place
- 6074 Myosotis St
- 6065 Ruby Place
- 6100 Myosotis St
- 6070 Myosotis St
- 6104 Myosotis St
- 6078 Ruby Place
- 6072 Ruby Place
- 6066 Myosotis St
- 6109 Ruby Place
- 6082 Ruby Place
- 6068 Ruby Place
- 6061 Ruby Place
- 6108 Myosotis St
- 6100 Ruby Place
Your Personal Tour Guide
Ask me questions while you tour the home.