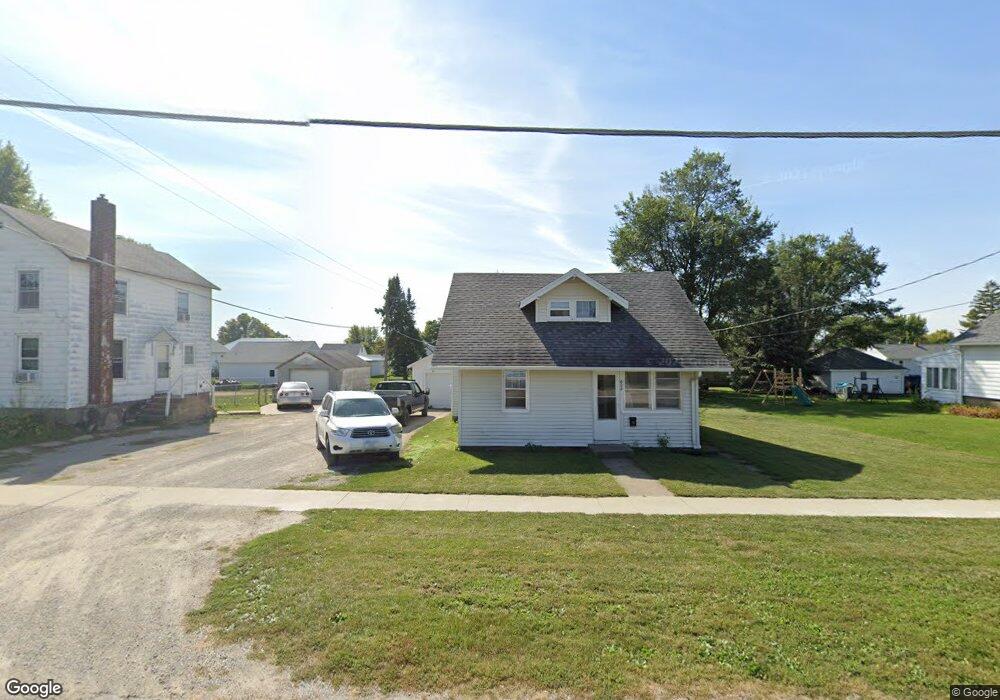
608 E 10th St Vinton, IA 52349
Estimated Value: $88,000 - $125,000
2
Beds
1
Bath
817
Sq Ft
$125/Sq Ft
Est. Value
About This Home
This home is located at 608 E 10th St, Vinton, IA 52349 and is currently estimated at $101,847, approximately $124 per square foot. 608 E 10th St is a home with nearby schools including Tilford Elementary School, Vinton-Shellsburg Middle School, and Vinton-Shellsburg High School.
Ownership History
Date
Name
Owned For
Owner Type
Purchase Details
Closed on
May 7, 2007
Sold by
Glime Joseph Duane and Glime Russell
Bought by
Beck Roger W and Beck Sandra F
Current Estimated Value
Home Financials for this Owner
Home Financials are based on the most recent Mortgage that was taken out on this home.
Original Mortgage
$35,000
Outstanding Balance
$21,324
Interest Rate
6.2%
Mortgage Type
Future Advance Clause Open End Mortgage
Estimated Equity
$80,523
Create a Home Valuation Report for This Property
The Home Valuation Report is an in-depth analysis detailing your home's value as well as a comparison with similar homes in the area
Home Values in the Area
Average Home Value in this Area
Purchase History
| Date | Buyer | Sale Price | Title Company |
|---|---|---|---|
| Beck Roger W | $35,000 | None Available |
Source: Public Records
Mortgage History
| Date | Status | Borrower | Loan Amount |
|---|---|---|---|
| Open | Beck Roger W | $35,000 |
Source: Public Records
Tax History
| Year | Tax Paid | Tax Assessment Tax Assessment Total Assessment is a certain percentage of the fair market value that is determined by local assessors to be the total taxable value of land and additions on the property. | Land | Improvement |
|---|---|---|---|---|
| 2025 | $1,396 | $80,400 | $16,500 | $63,900 |
| 2024 | $1,396 | $74,500 | $16,500 | $58,000 |
| 2023 | $1,304 | $74,500 | $16,500 | $58,000 |
| 2022 | $1,338 | $60,600 | $13,200 | $47,400 |
| 2021 | $1,338 | $60,600 | $13,200 | $47,400 |
| 2020 | $1,020 | $47,100 | $10,600 | $36,500 |
| 2019 | $1,066 | $47,100 | $10,600 | $36,500 |
| 2018 | $1,034 | $48,600 | $9,800 | $38,800 |
| 2017 | $998 | $48,600 | $9,800 | $38,800 |
| 2016 | $982 | $45,500 | $9,200 | $36,300 |
| 2015 | $982 | $45,500 | $9,200 | $36,300 |
| 2014 | $1,060 | $49,000 | $0 | $0 |
Source: Public Records
Map
Nearby Homes
Your Personal Tour Guide
Ask me questions while you tour the home.