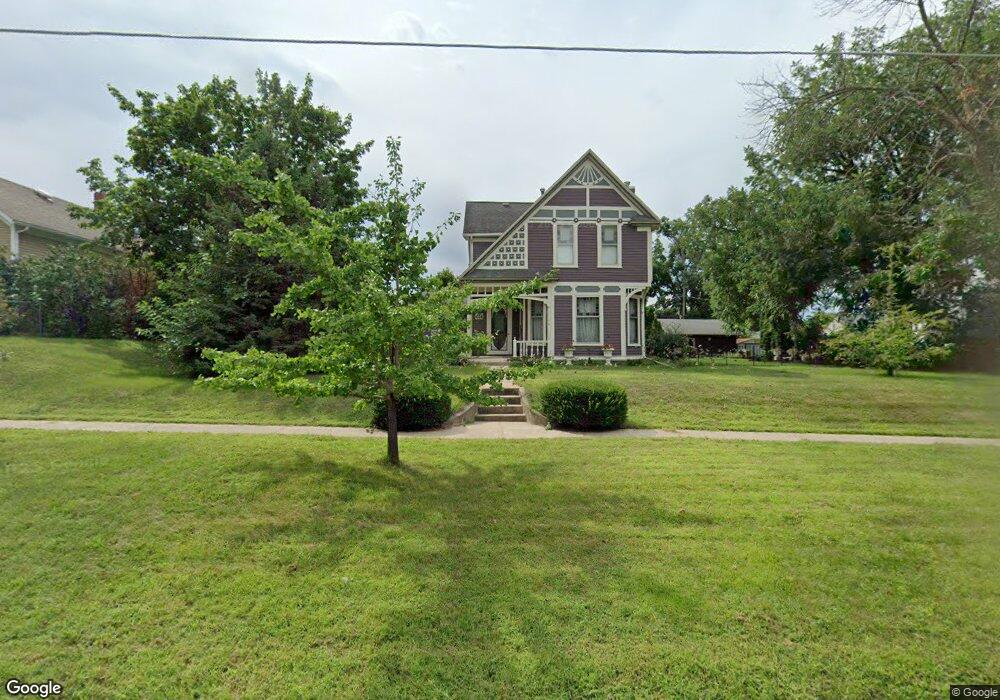
608 E 4th St Vinton, IA 52349
Estimated Value: $202,235 - $251,000
3
Beds
2
Baths
2,170
Sq Ft
$102/Sq Ft
Est. Value
About This Home
This home is located at 608 E 4th St, Vinton, IA 52349 and is currently estimated at $221,809, approximately $102 per square foot. 608 E 4th St is a home located in Benton County with nearby schools including Tilford Elementary School, Vinton-Shellsburg Middle School, and Vinton-Shellsburg High School.
Ownership History
Date
Name
Owned For
Owner Type
Purchase Details
Closed on
Sep 2, 2011
Sold by
Blank Joseph R
Bought by
Thompson David C and Thompson Kathy M
Current Estimated Value
Home Financials for this Owner
Home Financials are based on the most recent Mortgage that was taken out on this home.
Original Mortgage
$103,200
Outstanding Balance
$8,781
Interest Rate
3.67%
Mortgage Type
New Conventional
Estimated Equity
$213,028
Purchase Details
Closed on
Apr 25, 2011
Sold by
Gordon Crystal and Gordon Marvin
Bought by
Carlson Homestead Llc
Create a Home Valuation Report for This Property
The Home Valuation Report is an in-depth analysis detailing your home's value as well as a comparison with similar homes in the area
Home Values in the Area
Average Home Value in this Area
Purchase History
| Date | Buyer | Sale Price | Title Company |
|---|---|---|---|
| Thompson David C | $129,000 | None Available | |
| Carlson Homestead Llc | -- | -- |
Source: Public Records
Mortgage History
| Date | Status | Borrower | Loan Amount |
|---|---|---|---|
| Open | Thompson David C | $103,200 |
Source: Public Records
Tax History
| Year | Tax Paid | Tax Assessment Tax Assessment Total Assessment is a certain percentage of the fair market value that is determined by local assessors to be the total taxable value of land and additions on the property. | Land | Improvement |
|---|---|---|---|---|
| 2025 | $3,138 | $196,200 | $24,800 | $171,400 |
| 2024 | $3,138 | $177,700 | $23,800 | $153,900 |
| 2023 | $2,902 | $177,700 | $23,800 | $153,900 |
| 2022 | $2,976 | $143,700 | $19,000 | $124,700 |
| 2021 | $2,976 | $143,700 | $19,000 | $124,700 |
| 2020 | $2,888 | $142,300 | $21,400 | $120,900 |
| 2019 | $2,798 | $142,300 | $21,400 | $120,900 |
| 2018 | $2,714 | $136,200 | $20,300 | $115,900 |
| 2017 | $2,714 | $136,200 | $20,300 | $115,900 |
| 2016 | $2,560 | $127,300 | $19,000 | $108,300 |
| 2015 | $2,560 | $127,300 | $19,000 | $108,300 |
| 2014 | $2,668 | $132,100 | $0 | $0 |
Source: Public Records
Map
Nearby Homes
Your Personal Tour Guide
Ask me questions while you tour the home.