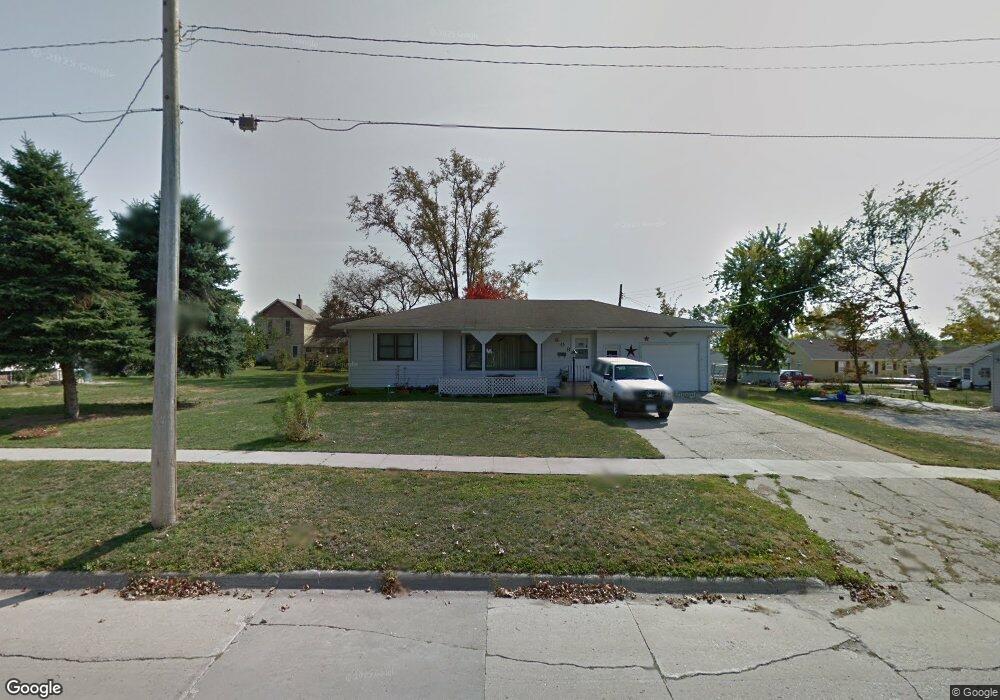
608 E 8th St Vinton, IA 52349
Estimated Value: $159,000 - $177,000
3
Beds
2
Baths
1,551
Sq Ft
$106/Sq Ft
Est. Value
About This Home
This home is located at 608 E 8th St, Vinton, IA 52349 and is currently estimated at $164,865, approximately $106 per square foot. 608 E 8th St is a home located in Benton County with nearby schools including Tilford Elementary School, Vinton-Shellsburg Middle School, and Vinton-Shellsburg High School.
Ownership History
Date
Name
Owned For
Owner Type
Purchase Details
Closed on
Dec 20, 2013
Sold by
Milne William J and Milne Patricia J
Bought by
Hatfield Justin R
Current Estimated Value
Home Financials for this Owner
Home Financials are based on the most recent Mortgage that was taken out on this home.
Original Mortgage
$88,369
Outstanding Balance
$66,490
Interest Rate
4.38%
Mortgage Type
FHA
Estimated Equity
$98,375
Create a Home Valuation Report for This Property
The Home Valuation Report is an in-depth analysis detailing your home's value as well as a comparison with similar homes in the area
Home Values in the Area
Average Home Value in this Area
Purchase History
| Date | Buyer | Sale Price | Title Company |
|---|---|---|---|
| Hatfield Justin R | $90,000 | None Available |
Source: Public Records
Mortgage History
| Date | Status | Borrower | Loan Amount |
|---|---|---|---|
| Open | Hatfield Justin R | $88,369 |
Source: Public Records
Tax History
| Year | Tax Paid | Tax Assessment Tax Assessment Total Assessment is a certain percentage of the fair market value that is determined by local assessors to be the total taxable value of land and additions on the property. | Land | Improvement |
|---|---|---|---|---|
| 2025 | $2,328 | $137,900 | $17,900 | $120,000 |
| 2024 | $2,328 | $124,200 | $17,200 | $107,000 |
| 2023 | $2,160 | $124,200 | $17,200 | $107,000 |
| 2022 | $2,218 | $100,400 | $13,700 | $86,700 |
| 2021 | $2,218 | $100,400 | $13,700 | $86,700 |
| 2020 | $1,986 | $91,800 | $13,800 | $78,000 |
| 2019 | $2,016 | $91,800 | $13,800 | $78,000 |
| 2018 | $1,960 | $92,000 | $13,200 | $78,800 |
| 2017 | $1,960 | $92,000 | $13,200 | $78,800 |
| 2016 | $1,854 | $85,900 | $12,300 | $73,600 |
| 2015 | $1,854 | $85,900 | $12,300 | $73,600 |
| 2014 | $1,956 | $90,500 | $0 | $0 |
Source: Public Records
Map
Nearby Homes
Your Personal Tour Guide
Ask me questions while you tour the home.