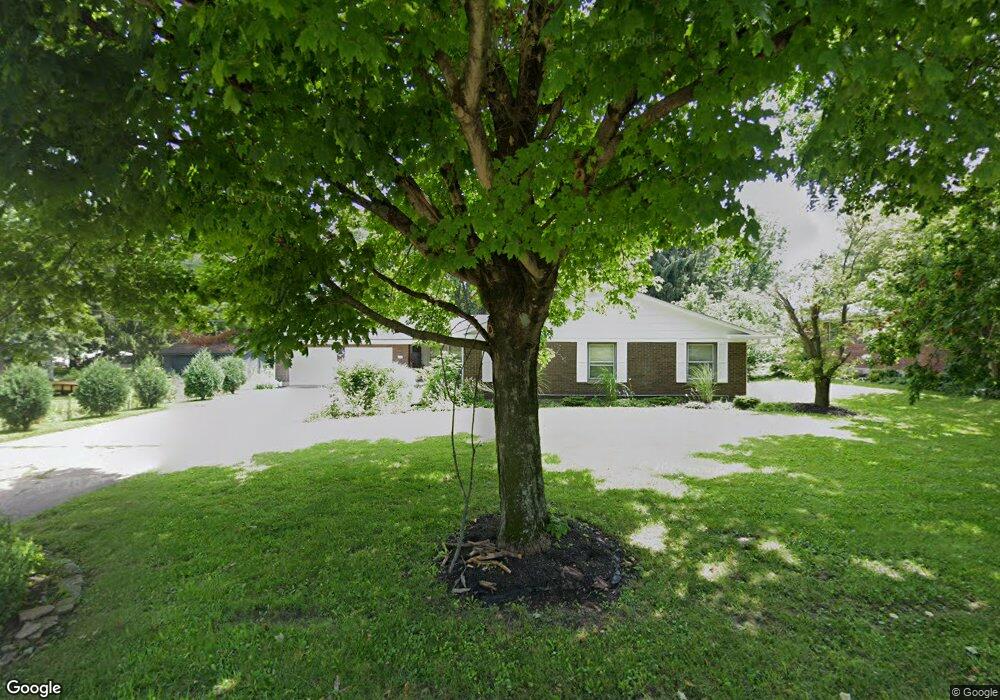
6089 Serena Way Middletown, OH 45044
Estimated Value: $335,000 - $378,000
4
Beds
2
Baths
2,377
Sq Ft
$147/Sq Ft
Est. Value
About This Home
This home is located at 6089 Serena Way, Middletown, OH 45044 and is currently estimated at $349,244, approximately $146 per square foot. 6089 Serena Way is a home located in Butler County with nearby schools including Monroe Primary School, Monroe Elementary School, and Monroe Junior High School.
Ownership History
Date
Name
Owned For
Owner Type
Purchase Details
Closed on
Jul 20, 2018
Sold by
Hattar Issa S
Bought by
Hattar Fawn
Current Estimated Value
Purchase Details
Closed on
Jul 31, 2007
Sold by
Shteiwi Hatem and Shteiwi Zainah
Bought by
Hattar Faten and Hattar Issa S
Home Financials for this Owner
Home Financials are based on the most recent Mortgage that was taken out on this home.
Original Mortgage
$156,000
Outstanding Balance
$97,294
Interest Rate
6.73%
Mortgage Type
Purchase Money Mortgage
Estimated Equity
$251,950
Purchase Details
Closed on
Aug 8, 2001
Sold by
Olenick Burchell T and Olenick Imogene
Bought by
Shteiwi Hatem
Home Financials for this Owner
Home Financials are based on the most recent Mortgage that was taken out on this home.
Original Mortgage
$155,300
Interest Rate
5.47%
Mortgage Type
Purchase Money Mortgage
Purchase Details
Closed on
Mar 1, 1991
Purchase Details
Closed on
May 1, 1985
Create a Home Valuation Report for This Property
The Home Valuation Report is an in-depth analysis detailing your home's value as well as a comparison with similar homes in the area
Home Values in the Area
Average Home Value in this Area
Purchase History
| Date | Buyer | Sale Price | Title Company |
|---|---|---|---|
| Hattar Fawn | -- | None Available | |
| Hattar Faten | $195,000 | Attorney | |
| Shteiwi Hatem | $163,500 | -- | |
| -- | $118,000 | -- | |
| -- | $78,500 | -- |
Source: Public Records
Mortgage History
| Date | Status | Borrower | Loan Amount |
|---|---|---|---|
| Open | Hattar Faten | $156,000 | |
| Previous Owner | Shteiwi Hatem | $155,300 |
Source: Public Records
Tax History
| Year | Tax Paid | Tax Assessment Tax Assessment Total Assessment is a certain percentage of the fair market value that is determined by local assessors to be the total taxable value of land and additions on the property. | Land | Improvement |
|---|---|---|---|---|
| 2025 | $4,160 | $92,350 | $14,300 | $78,050 |
| 2024 | $4,160 | $92,350 | $14,300 | $78,050 |
| 2023 | $4,132 | $98,320 | $14,300 | $84,020 |
| 2022 | $3,360 | $66,160 | $14,300 | $51,860 |
| 2021 | $3,238 | $66,160 | $14,300 | $51,860 |
| 2020 | $3,354 | $66,160 | $14,300 | $51,860 |
| 2019 | $2,954 | $54,040 | $14,130 | $39,910 |
| 2018 | $2,957 | $54,040 | $14,130 | $39,910 |
| 2017 | $3,019 | $54,040 | $14,130 | $39,910 |
| 2016 | $2,972 | $51,000 | $14,130 | $36,870 |
| 2015 | $2,939 | $51,000 | $14,130 | $36,870 |
| 2014 | $3,082 | $51,000 | $14,130 | $36,870 |
| 2013 | $3,082 | $54,190 | $14,130 | $40,060 |
Source: Public Records
Map
Nearby Homes
- 44 Churchill Manor Ct
- 3081 Granny Smith Ln
- 3202 Ben Harrison St
- 6098 Hamilton Middletown Rd
- 2048 Apple Knoll Ln
- 150 Stone Ridge Ln
- 3210 Finley St
- 3221 Yankee Rd
- 3222 Mohawk St
- 3113 Rufus St
- 3106 Rufus St
- 51 Kameron Dr
- 1613 Sheridan Ave
- 3102 Omaha St
- 1505 Pershing Ave
- 3101 Omaha St
- 3209 Seneca St
- 3262 Blue Springs Dr
- 2804 Yankee Rd
- 3280 Blue Springs Dr
- 6079 Serena Way
- 3439 Carol Ann Ln
- 3451 Carol Ann Ln
- 3467 Carol Ann Ln
- 3415 Carol Ann Ln
- 6057 Serena Way
- 6090 Serena Way
- 6080 Serena Way
- 6044 Serena Way
- 3403 Carol Ann Ln
- 6022 Serena Way
- 3428 Carol Ann Ln
- 3432 Carol Ann Ln
- 3458 Carol Ann Ln
- 3422 Carol Ann Ln
- 3491 Carol Ann Ln
- 6012 Serena Way
- 6073 Serena Way
- 6069 Serena Way
- 3410 Carol Ann Ln
Your Personal Tour Guide
Ask me questions while you tour the home.