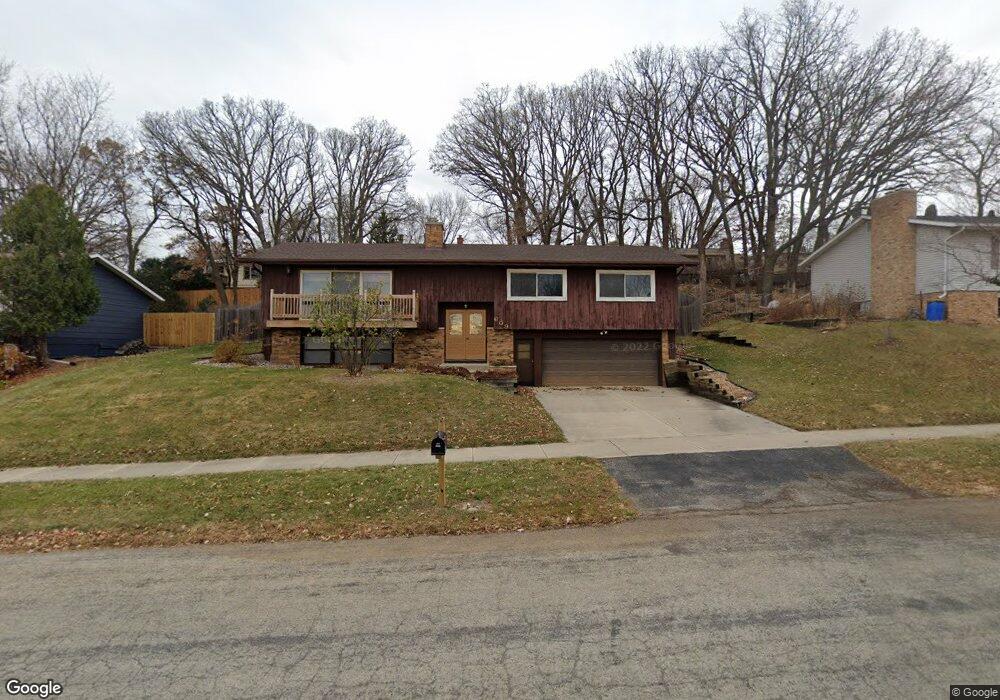
609 20th St NE Rochester, MN 55906
Estimated Value: $303,441 - $342,000
4
Beds
3
Baths
1,603
Sq Ft
$202/Sq Ft
Est. Value
About This Home
This home is located at 609 20th St NE, Rochester, MN 55906 and is currently estimated at $323,610, approximately $201 per square foot. 609 20th St NE is a home located in Olmsted County with nearby schools including Churchill Elementary School, Hoover Elementary School, and Kellogg Middle School.
Ownership History
Date
Name
Owned For
Owner Type
Purchase Details
Closed on
Sep 1, 2016
Sold by
Leroy Andrew J and Kehl Margaret M
Bought by
Leroy Andrew J and Kehl Margaret M
Current Estimated Value
Purchase Details
Closed on
Dec 22, 2008
Sold by
Deutsche Bank Trust Company Americas
Bought by
Leroy Andrew J and Kehl Margaret M
Purchase Details
Closed on
Apr 1, 2008
Sold by
Kuhlmann Richard and Khulmann Lori
Bought by
Deutsche Bank Trust Company Americas
Purchase Details
Closed on
Jun 7, 2005
Sold by
Halla John C and Halla Shannon R
Bought by
Kuhlman Richard and Kuhlman Lori
Home Financials for this Owner
Home Financials are based on the most recent Mortgage that was taken out on this home.
Original Mortgage
$149,520
Interest Rate
6.87%
Mortgage Type
Adjustable Rate Mortgage/ARM
Create a Home Valuation Report for This Property
The Home Valuation Report is an in-depth analysis detailing your home's value as well as a comparison with similar homes in the area
Home Values in the Area
Average Home Value in this Area
Purchase History
| Date | Buyer | Sale Price | Title Company |
|---|---|---|---|
| Leroy Andrew J | -- | Attorney | |
| Leroy Andrew J | $137,000 | Rochester Title & Escrow | |
| Deutsche Bank Trust Company Americas | $114,750 | None Available | |
| Kuhlman Richard | $186,900 | None Available |
Source: Public Records
Mortgage History
| Date | Status | Borrower | Loan Amount |
|---|---|---|---|
| Previous Owner | Kuhlman Richard | $149,520 |
Source: Public Records
Tax History Compared to Growth
Tax History
| Year | Tax Paid | Tax Assessment Tax Assessment Total Assessment is a certain percentage of the fair market value that is determined by local assessors to be the total taxable value of land and additions on the property. | Land | Improvement |
|---|---|---|---|---|
| 2024 | $3,278 | $234,500 | $45,000 | $189,500 |
| 2023 | $2,828 | $224,600 | $45,000 | $179,600 |
| 2022 | $2,638 | $226,400 | $45,000 | $181,400 |
| 2021 | $2,492 | $191,800 | $45,000 | $146,800 |
| 2020 | $2,034 | $180,900 | $45,000 | $135,900 |
| 2019 | $1,930 | $141,600 | $26,000 | $115,600 |
| 2018 | $1,704 | $135,100 | $26,000 | $109,100 |
| 2017 | $1,690 | $119,500 | $26,000 | $93,500 |
| 2016 | $1,626 | $115,900 | $26,000 | $89,900 |
| 2015 | $1,552 | $109,000 | $26,000 | $83,000 |
| 2014 | $1,496 | $110,500 | $26,000 | $84,500 |
| 2012 | -- | $108,900 | $26,000 | $82,900 |
Source: Public Records
Map
Nearby Homes
- 559 21st St NE
- 827 Sierra Ln NE
- 722 Northern Heights Dr NE
- 2106 8th Ave NE
- 703 Northern Hills Dr NE
- 1561 11th Ave NE
- 2522 Northern Hills Ct NE
- 421 15th St NE
- 1723 Teton Ln NE
- 121 14th St NE Unit 100
- 1409 11th Ave NE
- 1880 3rd Ave NW Unit 310
- 215 Elton Hills Dr NW Unit 52
- 215 Elton Hills Dr NW Unit 37
- 2645 Riverside Ln NE
- 783 26th St NE
- 1411 14th St NE
- 20 12th St NE
- 1502 3rd Ave NW
- 2129 E Heights Ln NE
- 603 603 20th-Street-ne
- 609 609 20th-Street-ne
- 603 20th St NE
- 617 20th St NE
- 617 617 20th-Street-ne
- 528 21st St NE
- 536 21st St NE
- 522 21st St NE
- 604 20th St NE
- 625 20th St NE
- 521 20th St NE
- 618 20th St NE
- 544 21st St NE
- 514 21st St NE
- 515 515 21st-Street-ne
- 620 20th St NE
- 515 20th St NE
- 552 21st St NE
- 633 20th St NE
- 622 20th St NE