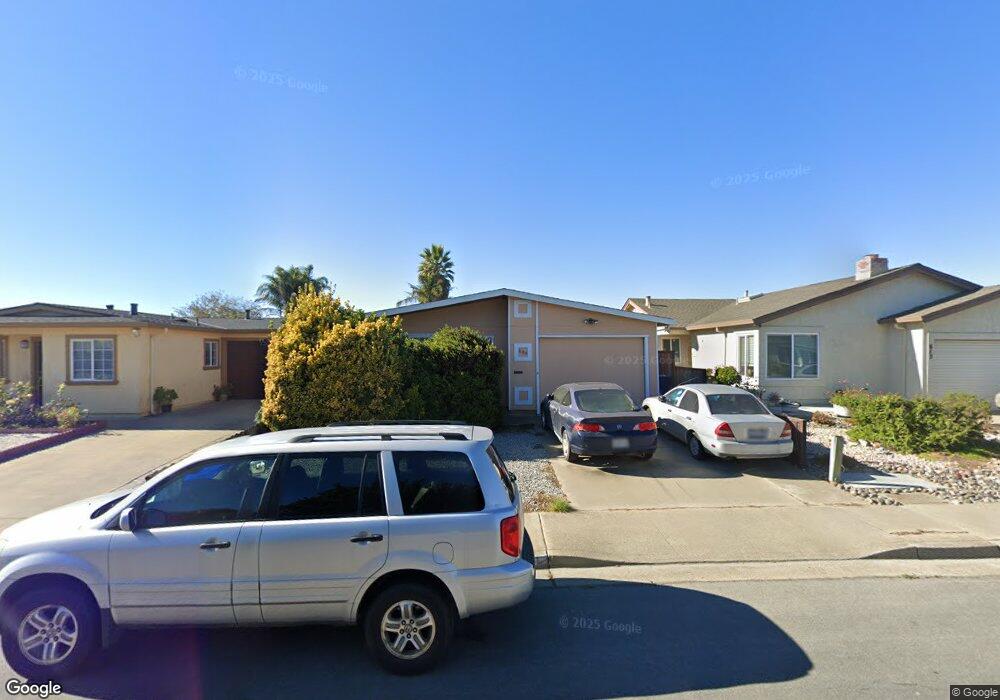
609 Cedar Dr Watsonville, CA 95076
Estimated Value: $516,277 - $571,000
2
Beds
1
Bath
930
Sq Ft
$585/Sq Ft
Est. Value
About This Home
This home is located at 609 Cedar Dr, Watsonville, CA 95076 and is currently estimated at $544,069, approximately $585 per square foot. 609 Cedar Dr is a home located in Santa Cruz County with nearby schools including Ann Soldo Elementary School, Lakeview Middle School, and Watsonville High School.
Ownership History
Date
Name
Owned For
Owner Type
Purchase Details
Closed on
May 23, 2007
Sold by
Der Dennis M and Der Nancy H
Bought by
Der Dennis M and Der Nancy H
Current Estimated Value
Home Financials for this Owner
Home Financials are based on the most recent Mortgage that was taken out on this home.
Original Mortgage
$210,000
Outstanding Balance
$127,388
Interest Rate
6.12%
Mortgage Type
Purchase Money Mortgage
Estimated Equity
$416,681
Purchase Details
Closed on
Oct 25, 1984
Sold by
Taniguchi Janet M and Taniguchi Hal M
Bought by
Der Dennis M and Der Nancy H
Create a Home Valuation Report for This Property
The Home Valuation Report is an in-depth analysis detailing your home's value as well as a comparison with similar homes in the area
Home Values in the Area
Average Home Value in this Area
Purchase History
| Date | Buyer | Sale Price | Title Company |
|---|---|---|---|
| Der Dennis M | $105,000 | Chicago Title Company | |
| Der Dennis M | -- | -- |
Source: Public Records
Mortgage History
| Date | Status | Borrower | Loan Amount |
|---|---|---|---|
| Open | Der Dennis M | $210,000 |
Source: Public Records
Tax History
| Year | Tax Paid | Tax Assessment Tax Assessment Total Assessment is a certain percentage of the fair market value that is determined by local assessors to be the total taxable value of land and additions on the property. | Land | Improvement |
|---|---|---|---|---|
| 2025 | $3,454 | $292,973 | $173,244 | $119,729 |
| 2023 | $3,401 | $281,596 | $166,517 | $115,079 |
| 2022 | $3,341 | $276,075 | $163,252 | $112,823 |
| 2021 | $3,285 | $270,662 | $160,051 | $110,611 |
| 2020 | $3,238 | $267,887 | $158,410 | $109,477 |
| 2019 | $3,181 | $262,634 | $155,304 | $107,330 |
| 2018 | $3,101 | $257,484 | $152,259 | $105,225 |
| 2017 | $3,075 | $252,435 | $149,274 | $103,161 |
| 2016 | $2,995 | $247,485 | $146,347 | $101,138 |
| 2015 | $2,985 | $243,768 | $144,149 | $99,619 |
| 2014 | $2,771 | $226,304 | $135,782 | $90,522 |
Source: Public Records
Map
Nearby Homes
Your Personal Tour Guide
Ask me questions while you tour the home.