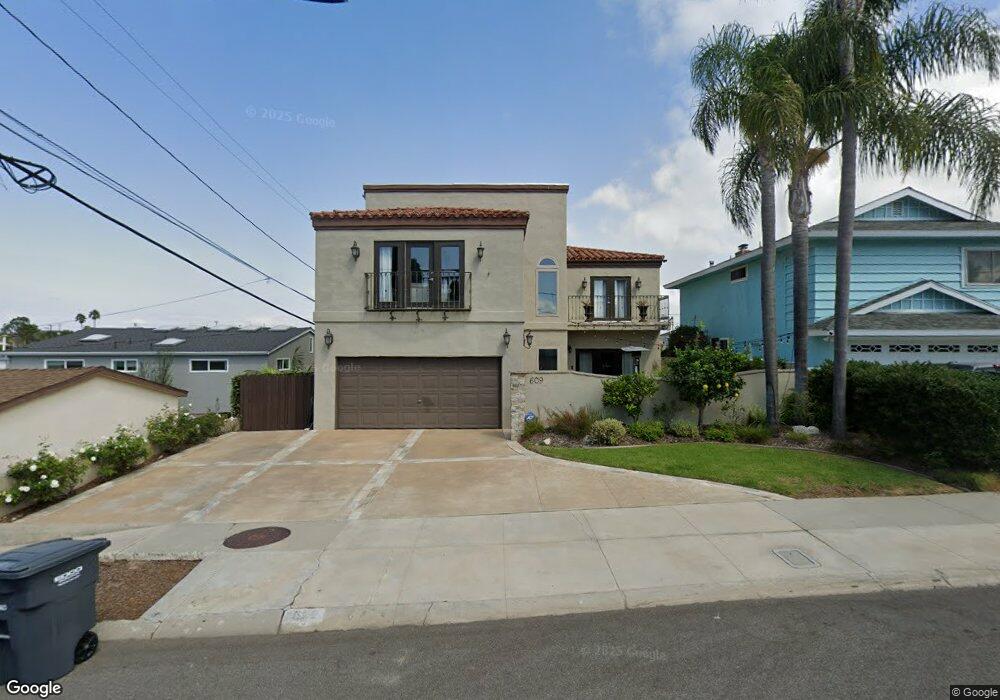
609 E Maple Ave El Segundo, CA 90245
Estimated Value: $2,207,000 - $2,728,000
5
Beds
3
Baths
2,740
Sq Ft
$911/Sq Ft
Est. Value
About This Home
This home is located at 609 E Maple Ave, El Segundo, CA 90245 and is currently estimated at $2,495,663, approximately $910 per square foot. 609 E Maple Ave is a home located in Los Angeles County with nearby schools including Center Street Elementary, El Segundo Middle School, and El Segundo High School.
Ownership History
Date
Name
Owned For
Owner Type
Purchase Details
Closed on
Jun 30, 2008
Sold by
Tellam Greg J
Bought by
Dierks Dean D and Dierks Dione M
Current Estimated Value
Home Financials for this Owner
Home Financials are based on the most recent Mortgage that was taken out on this home.
Original Mortgage
$550,000
Outstanding Balance
$354,281
Interest Rate
6.04%
Mortgage Type
Purchase Money Mortgage
Estimated Equity
$2,141,382
Purchase Details
Closed on
Nov 4, 2005
Sold by
Carpenter John S
Bought by
Tellam Greg J and Tellam Eileen
Home Financials for this Owner
Home Financials are based on the most recent Mortgage that was taken out on this home.
Original Mortgage
$856,000
Interest Rate
7.37%
Mortgage Type
Fannie Mae Freddie Mac
Purchase Details
Closed on
Jan 30, 1997
Sold by
Carpenter Carrie C
Bought by
Carpenter John S
Create a Home Valuation Report for This Property
The Home Valuation Report is an in-depth analysis detailing your home's value as well as a comparison with similar homes in the area
Home Values in the Area
Average Home Value in this Area
Purchase History
| Date | Buyer | Sale Price | Title Company |
|---|---|---|---|
| Dierks Dean D | $1,102,500 | Lawyers Title | |
| Tellam Greg J | $1,070,000 | -- | |
| Carpenter John S | -- | -- |
Source: Public Records
Mortgage History
| Date | Status | Borrower | Loan Amount |
|---|---|---|---|
| Open | Dierks Dean D | $550,000 | |
| Previous Owner | Tellam Greg J | $856,000 |
Source: Public Records
Tax History
| Year | Tax Paid | Tax Assessment Tax Assessment Total Assessment is a certain percentage of the fair market value that is determined by local assessors to be the total taxable value of land and additions on the property. | Land | Improvement |
|---|---|---|---|---|
| 2025 | $15,703 | $1,419,743 | $984,230 | $435,513 |
| 2024 | $15,703 | $1,391,906 | $964,932 | $426,974 |
| 2023 | $15,288 | $1,364,614 | $946,012 | $418,602 |
| 2022 | $15,454 | $1,337,858 | $927,463 | $410,395 |
| 2021 | $15,227 | $1,311,627 | $909,278 | $402,349 |
| 2019 | $14,706 | $1,272,725 | $882,309 | $390,416 |
| 2018 | $13,783 | $1,247,770 | $865,009 | $382,761 |
| 2016 | $13,375 | $1,199,320 | $831,421 | $367,899 |
| 2015 | $13,207 | $1,181,306 | $818,933 | $362,373 |
| 2014 | $12,916 | $1,158,167 | $802,892 | $355,275 |
Source: Public Records
Map
Nearby Homes
- 519 E Sycamore Ave
- 529 E Walnut Ave
- 860 Bungalow Dr
- 329 E Maple Ave
- 572 E Imperial Ave
- 426 E Imperial Ave
- 529 Sierra Place
- 1112 E Imperial Ave
- 1116 E Imperial Ave
- 432 Lomita St
- 212 E Imperial Ave Unit A
- 212 E Imperial Ave Unit E
- 121 E Walnut Ave
- 924 Main St
- 745 Main St
- 211 E Pine Ave
- 500 E Imperial Ave
- 935 Main St Unit 303
- 1510 E Maple Ave
- 1514 E Maple Ave
Your Personal Tour Guide
Ask me questions while you tour the home.