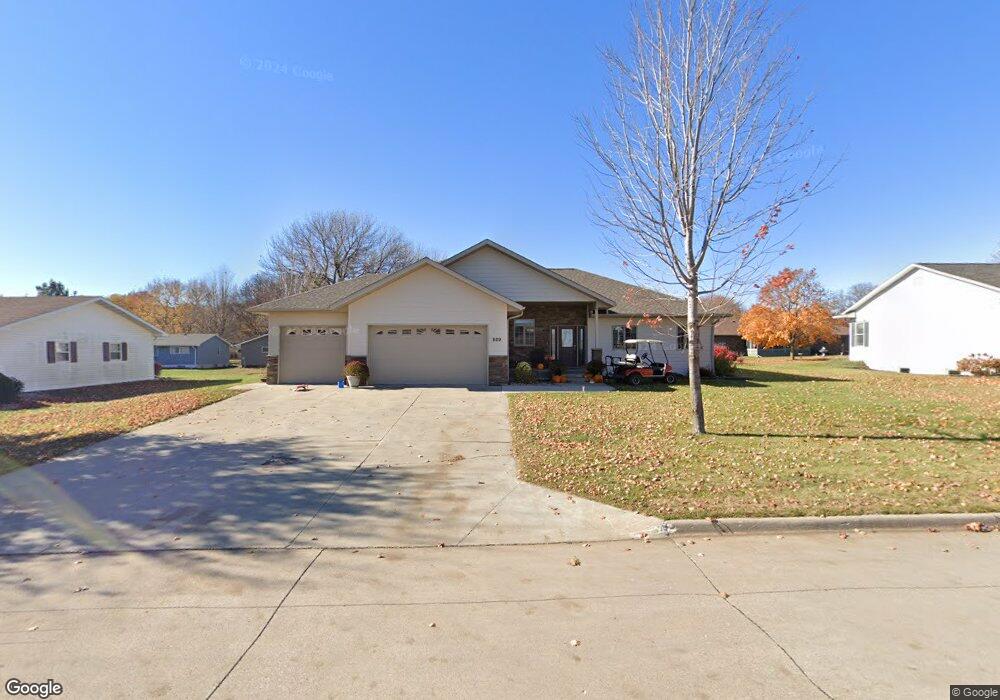
609 N Main St Wall Lake, IA 51466
Estimated Value: $321,000 - $467,000
--
Bed
1
Bath
1,919
Sq Ft
$205/Sq Ft
Est. Value
About This Home
This home is located at 609 N Main St, Wall Lake, IA 51466 and is currently estimated at $393,531, approximately $205 per square foot. 609 N Main St is a home with nearby schools including East Sac County High School.
Ownership History
Date
Name
Owned For
Owner Type
Purchase Details
Closed on
Jan 4, 2021
Sold by
Omg Midwest Inc
Bought by
T2s2 Invetsments Llc
Current Estimated Value
Purchase Details
Closed on
Nov 23, 2011
Sold by
Moeller Ruth M
Bought by
Wall Lake Lumber Co
Purchase Details
Closed on
Nov 7, 2011
Sold by
Moeller Michael G
Bought by
Wall Lake Lumber Co
Purchase Details
Closed on
May 27, 2010
Sold by
Moeller Ruth
Bought by
Moeller Michael G and Moeller Keri L
Purchase Details
Closed on
Oct 26, 2005
Sold by
Pittman Virtus and Pittman Betty
Bought by
Moeller Gordon C and Moeller Ruth M
Create a Home Valuation Report for This Property
The Home Valuation Report is an in-depth analysis detailing your home's value as well as a comparison with similar homes in the area
Home Values in the Area
Average Home Value in this Area
Purchase History
| Date | Buyer | Sale Price | Title Company |
|---|---|---|---|
| T2s2 Invetsments Llc | $484,500 | None Available | |
| Wall Lake Lumber Co | $9,000 | None Available | |
| Wall Lake Lumber Co | -- | None Available | |
| Wall Lake Lumber Co | -- | None Available | |
| Moeller Michael G | -- | None Available | |
| Moeller Gordon C | $8,500 | None Available |
Source: Public Records
Tax History Compared to Growth
Tax History
| Year | Tax Paid | Tax Assessment Tax Assessment Total Assessment is a certain percentage of the fair market value that is determined by local assessors to be the total taxable value of land and additions on the property. | Land | Improvement |
|---|---|---|---|---|
| 2025 | $4,563 | $356,400 | $5,390 | $351,010 |
| 2024 | $4,563 | $320,130 | $4,900 | $315,230 |
| 2023 | $3,704 | $320,130 | $4,900 | $315,230 |
| 2022 | $3,530 | $236,320 | $4,900 | $231,420 |
| 2021 | $3,530 | $236,320 | $4,900 | $231,420 |
| 2020 | $3,000 | $205,540 | $4,900 | $200,640 |
| 2019 | $2,998 | $205,540 | $4,900 | $200,640 |
| 2018 | $3,132 | $199,510 | $0 | $0 |
| 2017 | $3,132 | $192,190 | $0 | $0 |
| 2016 | $2,846 | $187,530 | $0 | $0 |
| 2015 | $2,846 | $180,160 | $0 | $0 |
| 2014 | $2,748 | $3,190 | $0 | $0 |
Source: Public Records
Map
Nearby Homes