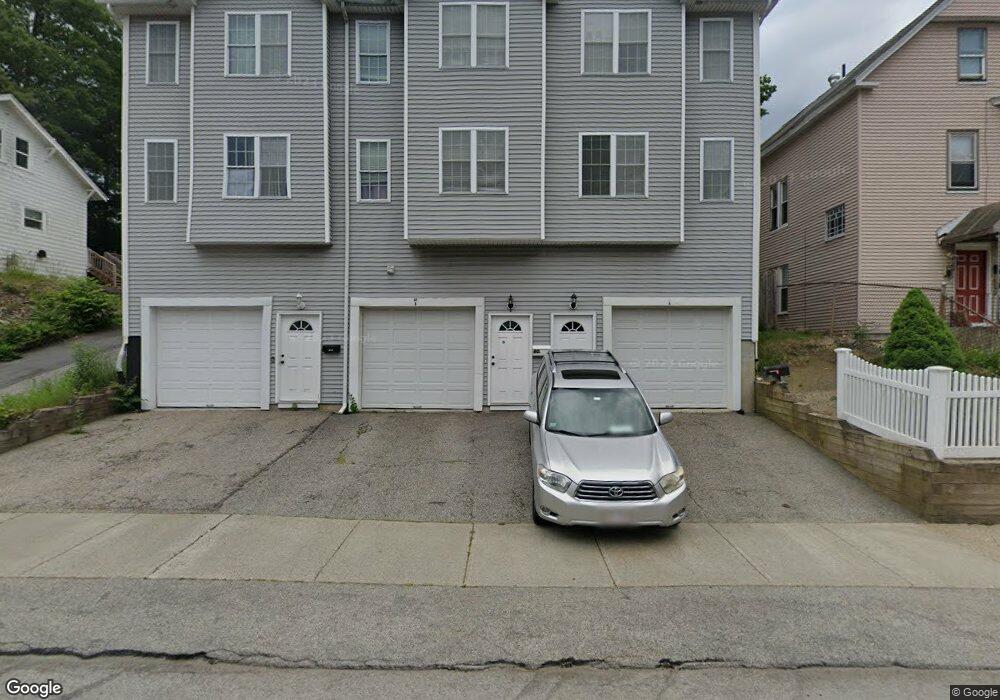
60A Paine St Worcester, MA 01605
Brittan Square NeighborhoodEstimated Value: $358,000 - $468,000
3
Beds
2
Baths
1,536
Sq Ft
$258/Sq Ft
Est. Value
About This Home
This home is located at 60A Paine St, Worcester, MA 01605 and is currently estimated at $396,433, approximately $258 per square foot. 60A Paine St is a home located in Worcester County with nearby schools including City View, Jacob Hiatt Magnet School, and Chandler Magnet.
Ownership History
Date
Name
Owned For
Owner Type
Purchase Details
Closed on
Mar 9, 2020
Sold by
Rodriguez Esteban and Rivera Maria
Bought by
Rodriguez Esteban and Parrales Genny M
Current Estimated Value
Home Financials for this Owner
Home Financials are based on the most recent Mortgage that was taken out on this home.
Original Mortgage
$157,000
Outstanding Balance
$137,843
Interest Rate
3.5%
Mortgage Type
New Conventional
Estimated Equity
$258,590
Purchase Details
Closed on
Jul 1, 2009
Sold by
G & K Assoc
Bought by
Rodriguez Esteban and Rivera Maria
Home Financials for this Owner
Home Financials are based on the most recent Mortgage that was taken out on this home.
Original Mortgage
$119,350
Interest Rate
4.86%
Mortgage Type
Purchase Money Mortgage
Create a Home Valuation Report for This Property
The Home Valuation Report is an in-depth analysis detailing your home's value as well as a comparison with similar homes in the area
Home Values in the Area
Average Home Value in this Area
Purchase History
| Date | Buyer | Sale Price | Title Company |
|---|---|---|---|
| Rodriguez Esteban | $15,000 | None Available | |
| Rodriguez Esteban | $156,000 | -- |
Source: Public Records
Mortgage History
| Date | Status | Borrower | Loan Amount |
|---|---|---|---|
| Open | Rodriguez Esteban | $157,000 | |
| Previous Owner | Rodriguez Esteban | $119,350 |
Source: Public Records
Tax History
| Year | Tax Paid | Tax Assessment Tax Assessment Total Assessment is a certain percentage of the fair market value that is determined by local assessors to be the total taxable value of land and additions on the property. | Land | Improvement |
|---|---|---|---|---|
| 2025 | $4,561 | $345,800 | $55,700 | $290,100 |
| 2024 | $4,313 | $313,700 | $55,700 | $258,000 |
| 2023 | $4,154 | $289,700 | $48,400 | $241,300 |
| 2022 | $3,799 | $249,800 | $38,700 | $211,100 |
| 2021 | $3,769 | $231,500 | $31,000 | $200,500 |
| 2020 | $3,677 | $216,300 | $30,800 | $185,500 |
| 2019 | $3,523 | $195,700 | $26,800 | $168,900 |
| 2018 | $3,498 | $185,000 | $26,800 | $158,200 |
| 2017 | $3,277 | $170,500 | $26,800 | $143,700 |
| 2016 | $3,318 | $161,000 | $20,400 | $140,600 |
| 2015 | $3,231 | $161,000 | $20,400 | $140,600 |
| 2014 | $3,146 | $161,000 | $20,400 | $140,600 |
Source: Public Records
Map
Nearby Homes
- 176 Lincoln St Unit 4
- 74 Green Hill Pkwy
- 27 Harlow St
- 78 Green Hill Pkwy
- 3 Perkins St
- 26 Orne St
- 249 Lincoln St
- 139 Lincoln St
- 33 Denmark St
- 20B Edgeworth St
- 63 North St Unit D
- 63 North St Unit C
- 63 North St Unit B
- 63 North St Unit A
- 32 Hemans St
- 24 Catharine St
- Lot 2 Ararat
- 10 Dryden St Unit 7
- 21 Kendall St
- 15 Breck St
Your Personal Tour Guide
Ask me questions while you tour the home.