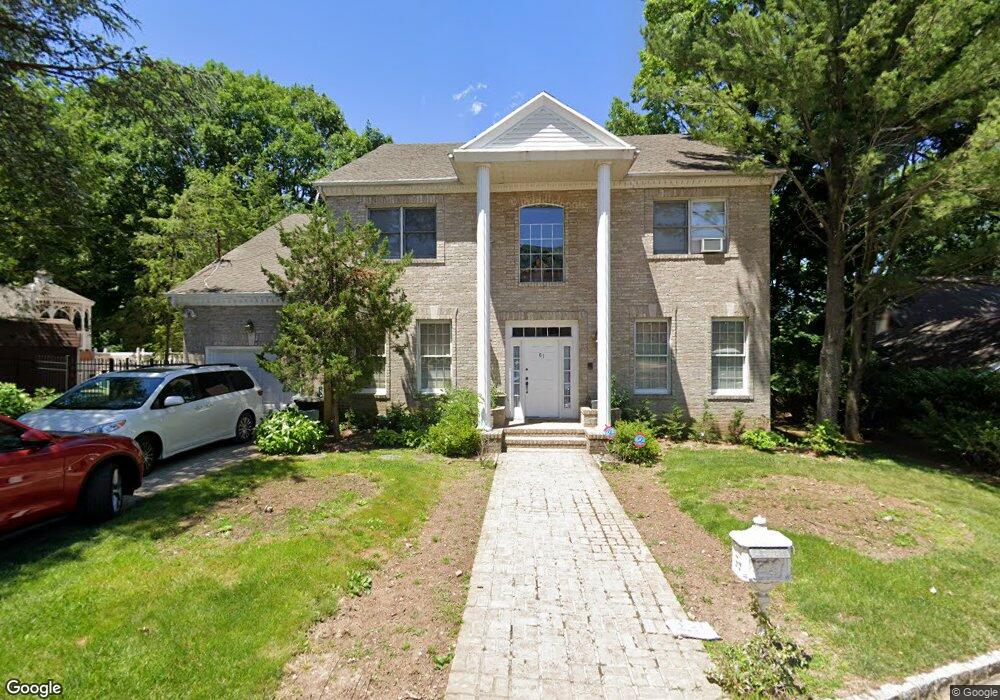
61 E Loop Rd Staten Island, NY 10304
Todt Hill NeighborhoodEstimated Value: $1,977,394 - $2,468,000
6
Beds
5
Baths
5,049
Sq Ft
$458/Sq Ft
Est. Value
About This Home
This home is located at 61 E Loop Rd, Staten Island, NY 10304 and is currently estimated at $2,311,849, approximately $457 per square foot. 61 E Loop Rd is a home located in Richmond County with nearby schools including P.S. 11 Thomas Dongan School, Is 2 George L Egbert, and New Dorp High School.
Ownership History
Date
Name
Owned For
Owner Type
Purchase Details
Closed on
Dec 19, 2013
Sold by
Galvin Mary B
Bought by
Bisogna Deborah and Galvin Mary B
Current Estimated Value
Purchase Details
Closed on
Apr 8, 2009
Sold by
Francis William and Galvin Mary B
Bought by
Galvin Mary B
Purchase Details
Closed on
Feb 29, 1996
Sold by
Sundaram Krishnamurthi and Sundaram Revathy
Bought by
Francis William and Galvin Mary B
Create a Home Valuation Report for This Property
The Home Valuation Report is an in-depth analysis detailing your home's value as well as a comparison with similar homes in the area
Home Values in the Area
Average Home Value in this Area
Purchase History
| Date | Buyer | Sale Price | Title Company |
|---|---|---|---|
| Bisogna Deborah | -- | Titlevest | |
| Galvin Mary B | $400,000 | None Available | |
| Francis William | $700,000 | Commonwealth Land Title Ins |
Source: Public Records
Tax History
| Year | Tax Paid | Tax Assessment Tax Assessment Total Assessment is a certain percentage of the fair market value that is determined by local assessors to be the total taxable value of land and additions on the property. | Land | Improvement |
|---|---|---|---|---|
| 2025 | $17,138 | $115,200 | $19,078 | $96,122 |
| 2024 | $17,138 | $106,320 | $19,502 | $86,818 |
| 2023 | $8,665 | $85,328 | $21,033 | $64,295 |
| 2022 | $8,453 | $99,480 | $24,300 | $75,180 |
| 2021 | $16,814 | $90,960 | $24,300 | $66,660 |
| 2020 | $12,147 | $93,720 | $24,300 | $69,420 |
| 2019 | $14,875 | $84,720 | $24,300 | $60,420 |
| 2018 | $14,495 | $71,107 | $17,865 | $53,242 |
| 2017 | $14,386 | $70,572 | $24,283 | $46,289 |
| 2016 | $13,310 | $66,578 | $20,552 | $46,026 |
| 2015 | $11,372 | $62,810 | $17,397 | $45,413 |
| 2014 | $11,372 | $59,256 | $14,878 | $44,378 |
Source: Public Records
Map
Nearby Homes
- 76 Jenna Ln
- 40 Jenna Ln
- 90 Flagg Place
- 70 Jenna Ln
- 20 Buel Ave Unit A
- 51 Romer Rd
- 131 Jefferson St
- 59 & 51 Garretson Ave
- 1 Utopia Ct
- 107 Jefferson St
- 91 W Entry Rd
- 130 Jefferson St
- 186 Flagg Place
- 105 Seaview Ave
- 51 Cromwell Cir
- 65 Alter Ave
- 00 Flagg Place
- 0 Flagg Place
- 107 Liberty Ave
- 125 Garretson Ave
Your Personal Tour Guide
Ask me questions while you tour the home.