
Seller's Agent in 2025
Keren Abraham
Keller Williams Village Square Realty
(201) 913-7283
33 in this area
50 Total Sales
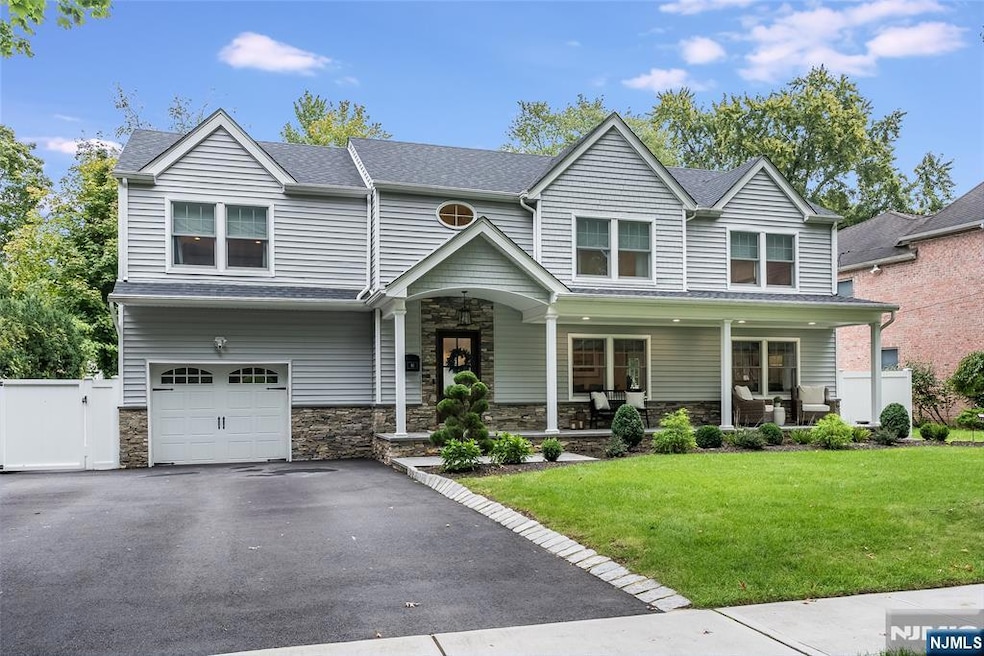
Nestled in a serene neighborhood in desirable Paramus, this magnificent, completely renovated and updated colonial-style home is a true gem. Upon entering you will be greeted by the spacious and inviting living areas featuring an open floor plan including, large dining room, eat in kitchen, pantry, large family room and powder room. Step outside and discover your own paradise, meticulously landscaped backyard with a deck, paved patio and an in-ground Gunite saltwater pool perfect for entertaining. On the second floor you will find generously sized bedrooms, full bathroom with high end fixtures and stylish finishes. Primary bedroom with walk- in closet, primary bath with double vanity and a glass shower. The basement is full, finished with laundry room and a half bath. This home features 2021 renovation, new roof, new A/C, newer furnace, new electric panel etc. This home is conveniently located near schools, parks, in proximity to NYC bus and shopping. call Keren 201-9137283 for more info.
Last Agent to Sell the Property
Keller Williams Village Square Realty Listed on: 05/28/2025
| Date | Type | Sale Price | Title Company |
|---|---|---|---|
| Deed | $1,510,000 | Surety Title | |
| Deed | $595,000 | Attorney | |
| Deed | $400,000 | -- |
| Date | Status | Loan Amount | Loan Type |
|---|---|---|---|
| Open | $800,000 | New Conventional | |
| Previous Owner | $390,000 | New Conventional | |
| Previous Owner | $234,200 | No Value Available |
| Date | Event | Price | List to Sale | Price per Sq Ft |
|---|---|---|---|---|
| 08/08/2025 08/08/25 | Sold | $1,510,000 | +20.9% | $634 / Sq Ft |
| 06/05/2025 06/05/25 | Pending | -- | -- | -- |
| 05/28/2025 05/28/25 | For Sale | $1,249,000 | -- | $524 / Sq Ft |
| Year | Tax Paid | Tax Assessment Tax Assessment Total Assessment is a certain percentage of the fair market value that is determined by local assessors to be the total taxable value of land and additions on the property. | Land | Improvement |
|---|---|---|---|---|
| 2025 | $12,762 | $926,700 | $443,000 | $483,700 |
| 2024 | $12,333 | $842,900 | $382,900 | $460,000 |
| 2023 | $11,701 | $804,000 | $365,300 | $438,700 |
| 2022 | $11,701 | $753,900 | $341,400 | $412,500 |
| 2021 | $10,949 | $662,000 | $311,300 | $350,700 |
| 2020 | $10,323 | $647,200 | $301,300 | $345,900 |
| 2019 | $9,837 | $530,000 | $279,800 | $250,200 |
| 2018 | $9,715 | $530,000 | $279,800 | $250,200 |
| 2017 | $9,545 | $530,000 | $279,800 | $250,200 |
| 2016 | $9,286 | $530,000 | $279,800 | $250,200 |
| 2015 | $9,190 | $530,000 | $279,800 | $250,200 |
| 2014 | $9,111 | $530,000 | $279,800 | $250,200 |
Seller's Agent in 2025
Keren Abraham
Keller Williams Village Square Realty
(201) 913-7283
33 in this area
50 Total Sales
Buyer's Agent in 2025
Carole Leflore
Compass New Jersey, LLC-Montclair
(646) 591-1656
1 in this area
61 Total Sales
Source: New Jersey MLS
MLS Number: 25017356
APN: 46-04209-0000-00019
Disclaimer: Certain information contained herein is derived from information provided by parties other than Homes.com. All information provided is deemed reliable, but is not guaranteed to be accurate and should be independently verified.
![]() The data relating to the real estate for sale on this web site comes in part from the Internet Data Exchange Program of the NJMLS. Real estate listings held by brokerage firms other than Ten-X are marked with the Internet Data Exchange logo and information about them includes the name of the listing brokers. Some properties listed with the participating brokers do not appear on this website at the request of the seller. Listings of brokers that do not participate in Internet Data Exchange do not appear on this website.
The data relating to the real estate for sale on this web site comes in part from the Internet Data Exchange Program of the NJMLS. Real estate listings held by brokerage firms other than Ten-X are marked with the Internet Data Exchange logo and information about them includes the name of the listing brokers. Some properties listed with the participating brokers do not appear on this website at the request of the seller. Listings of brokers that do not participate in Internet Data Exchange do not appear on this website.
All information deemed reliable but not guaranteed. Source: New Jersey Multiple Listing, Inc.
© 2026 New Jersey Multiple Listing Service Inc. All rights reserved.
Ask me questions while you tour the home.