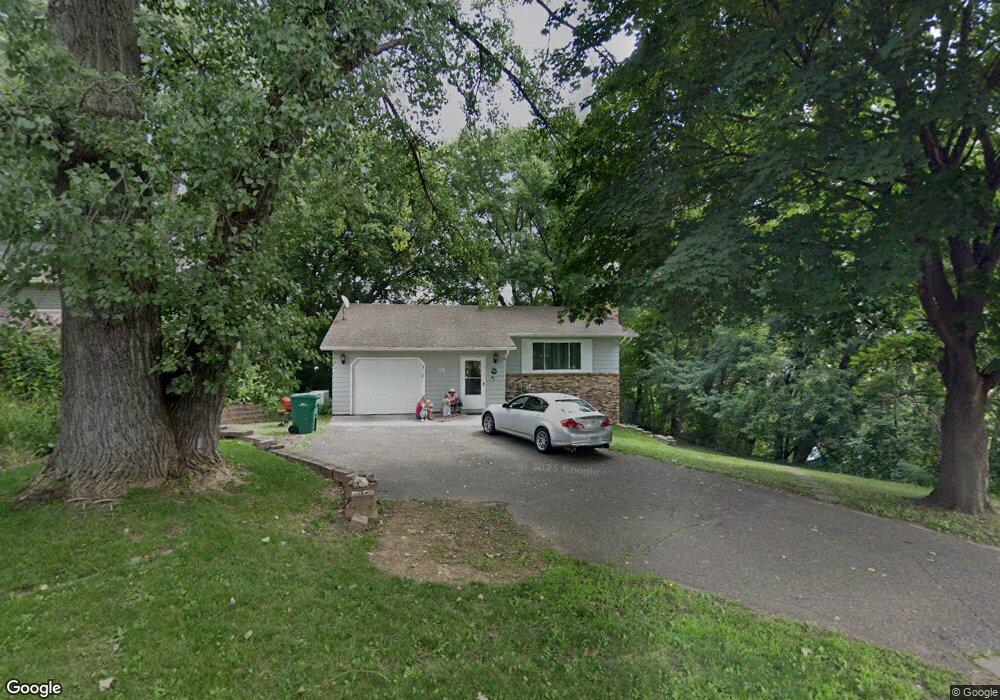
61 Greystone Ave N Saint Paul, MN 55128
Estimated Value: $319,000 - $339,000
3
Beds
3
Baths
1,638
Sq Ft
$199/Sq Ft
Est. Value
About This Home
This home is located at 61 Greystone Ave N, Saint Paul, MN 55128 and is currently estimated at $325,764, approximately $198 per square foot. 61 Greystone Ave N is a home located in Washington County with nearby schools including Skyview Community Middle School, Tartan Senior High School, and Apostolic Bible Institute.
Ownership History
Date
Name
Owned For
Owner Type
Purchase Details
Closed on
Nov 12, 2020
Sold by
Lemke Richard A and Lemke Catherine L
Bought by
Saleem Abdullah M and Merriman Rosetta
Current Estimated Value
Home Financials for this Owner
Home Financials are based on the most recent Mortgage that was taken out on this home.
Original Mortgage
$257,224
Outstanding Balance
$253,204
Interest Rate
2.8%
Mortgage Type
FHA
Estimated Equity
$72,560
Purchase Details
Closed on
Nov 28, 2018
Sold by
Her Paoze and Her Song Lor
Bought by
Lemke Richard A and Lemke Catherine L
Home Financials for this Owner
Home Financials are based on the most recent Mortgage that was taken out on this home.
Original Mortgage
$162,800
Interest Rate
4.8%
Mortgage Type
New Conventional
Purchase Details
Closed on
Sep 2, 2005
Sold by
Brunell Shaun and Brunell Bunny
Bought by
Hek Paoze
Create a Home Valuation Report for This Property
The Home Valuation Report is an in-depth analysis detailing your home's value as well as a comparison with similar homes in the area
Home Values in the Area
Average Home Value in this Area
Purchase History
| Date | Buyer | Sale Price | Title Company |
|---|---|---|---|
| Saleem Abdullah M | $262,000 | The Title Group Inc | |
| Lemke Richard A | $203,500 | Ancona Title & Escrow | |
| Hek Paoze | $180,000 | -- | |
| Saleem Abdullah Abdullah | $262,000 | -- |
Source: Public Records
Mortgage History
| Date | Status | Borrower | Loan Amount |
|---|---|---|---|
| Open | Saleem Abdullah M | $257,224 | |
| Previous Owner | Lemke Richard A | $162,800 | |
| Closed | Saleem Abdullah Abdullah | $262,000 |
Source: Public Records
Tax History Compared to Growth
Tax History
| Year | Tax Paid | Tax Assessment Tax Assessment Total Assessment is a certain percentage of the fair market value that is determined by local assessors to be the total taxable value of land and additions on the property. | Land | Improvement |
|---|---|---|---|---|
| 2024 | $3,510 | $312,400 | $100,000 | $212,400 |
| 2023 | $3,510 | $326,700 | $120,000 | $206,700 |
| 2022 | $2,900 | $297,500 | $109,700 | $187,800 |
| 2021 | $2,812 | $251,100 | $92,500 | $158,600 |
| 2020 | $2,716 | $243,400 | $95,000 | $148,400 |
| 2019 | $2,486 | $231,100 | $84,000 | $147,100 |
| 2018 | $2,478 | $214,600 | $80,000 | $134,600 |
| 2017 | $2,492 | $195,600 | $78,000 | $117,600 |
| 2016 | $2,278 | $185,600 | $72,000 | $113,600 |
| 2015 | $2,150 | $166,900 | $63,000 | $103,900 |
| 2013 | -- | $124,300 | $46,700 | $77,600 |
Source: Public Records
Map
Nearby Homes
- 305 Greystone Ave N
- 660 Greene Ave N
- 6465 Edgewood Ave
- 6783 8th St N
- 698 Grafton Ave N
- 6884 8th Street Ln N
- 659 Goodview Ave N
- 329 Geneva Ave N Unit 411
- 329 Geneva Ave N Unit 403
- 329 Geneva Ave N Unit 413
- 7525 5th St N
- 6249 Oak Knoll Dr
- 6864 8th Street Ln N
- 509 Gentry Ave N
- 6860 8th Street Ln N
- 489 Gentry Ave N
- 503 N Gentry Ave N
- 422 Hickory Ln N
- 484 Hickory Ln N
- 662 Gentry Ave N
- 79 Greystone Ave N
- 97 Greystone Ave N
- 6789 1st St N
- 105 Greystone Ave N
- 6773 1st St N
- 123 Greystone Ave N
- 114 Greystone Ave N
- 6767 1st St N
- 6780 Hudson Blvd
- 6780 Hudson Blvd N
- 122 Greystone Ave N
- 131 Greystone Ave N
- 6751 1st St N
- 132 Greystone Ave N
- 107 Gresham Ave N
- 145 Greystone Ave N
- 6735 1st St N
- 117 Gresham Ave N
- 142 Greystone Ave N
- 155 Greystone Ave N